
By Chris Callaghan, Rob Schroeder, and Dr. Wayne Porter
Introduction
In light of the current National Security Strategy and the 2018 National Defense Guidance, the impact of hybrid warfare and ‘gray-zone’1 maritime activity in support of great power competition among nations has become an increasing area of concern. This includes the need for an increased focus on the identification and tracking of vessels of interest (VOI) and their associated owners, operators, and activities. Traditionally, maritime domain awareness (MDA) has consisted of intelligence, surveillance, and reconnaissance of activities at sea with limited cross-domain link analysis2 of events, carriers, and sponsors (Wallace & Mesko, 2013). While this methodology enables analysts and operators to sift and structure vast data from increasingly complex systems, it fails to consider how ties between similar entities create gray (non-transparent) shipping networks capable of supporting state-directed hybrid warfare.
This is not to say that a network perspective has been absent from the maritime domain. Researchers from diverse analytic disciplines have conceptualized various constructs as networks, such as historic trade routes (Rivers, Evans, & Knappett, 2016; Wang, Notteboom, & Yang, 2016), global shipping patterns (Ducruet, Rozenblat, & Zaidi, 2010), cruise ship itineraries (Rodrigue & Notteboom, 2014), and logistics involved in global shipping (Ducruet & Lugo, 2013). Yet, much of the focus behind this work has been on understanding transparent (licit) networks.3 For their part, network researchers leveraged social network analysis to gain an understanding of dark networks – that is, covert and/or illicit organizations (Raab & Milward, 2003). This has included, for example, the study of terrorist groups (Krebs, 2002; Roberts & Everton, 2011), narcotic distribution networks (Morselli & Petit, 2007), street gangs (Papachristos, Hureau, & Braga, 2013), and cyber criminals on the dark web (Dupont, 2014) to name a few.
We drew on network analysis (NA) to examine gray maritime networks (alternately operating licitly and illicitly) in relationship to two NATO-led exercises in 2018: BALTOPS and Exercise Trident Juncture. As previously demonstrated through research focused on mapping gray maritime networks in the South China Sea (Porter, et al., 2019), NA methods can be leveraged to develop longitudinal network depictions of vessels loitering in sensitive or disputed areas. Here, we leverage commercially available geo-temporal data, open-source databases, and home range detection algorithms to generate depictions of the subgroups of owners and operators associated with gray activities.
Although methodology driven, this research was not intended to provide solely an academic contribution but also to demonstrate how NA can improve real-time awareness and tracking for operational purposes. The methods and analysis presented here should enable a rich discussion of current and future methods for enhanced MDA. As such, we begin with a description of our data collection and methods then proceed to discuss findings and practical implications for MDA. Finally, we conclude with a series of recommendations for further research.
Generating Networks: Data and Methods
We use commercially available ship tracking data as the cornerstone of our analysis; specifically, in the process of identifying and tracking VOIs. Our team collected the feeds from commercial automatic identification system (AIS) transceivers from 13 March 2018 through 7 January 2019.4 These data points are particularly salient as AIS transmitters are required as navigation and anti-collision systems for all vessels exceeding 300 gross tonnage operating internationally, any vessels exceeding 500 gross tonnage not conducting international voyages, and all passenger ships regardless of size. To narrow the scope of our data set, we geofenced our data to include the Baltic Sea and the North Atlantic Ocean. The resulting daily AIS tracking logs provided both spatial and temporal variables relevant to our analysis; namely, a VOI’s date and time of transmission, maritime mobile service identity (MMSI) number, speed over ground, longitude, and latitude.
Once the data was decoded and filtered, we proceeded to explore traffic patterns using the Time Local Convex Hull (T-LoCoH) method originally developed for the study of movement patterns in GPS-tracked ranging animals. T-LoCoH integrates time with space into the construction of local hulls (geometric shapes containing a location distribution within a home range) while accounting for an individual animal’s speed, which facilitates the use of metrics for revisitation and loitering duration (Lyons, Turner, & Getz, 2013). In our work, the AIS data that tracks vessel traffic over time and space is analogous to the GPS data used to analyze ranging animals. As such, we leveraged the application of this method to identify spatio-temporal patterns of ships loitering in areas proximal to NATO-led military exercises.
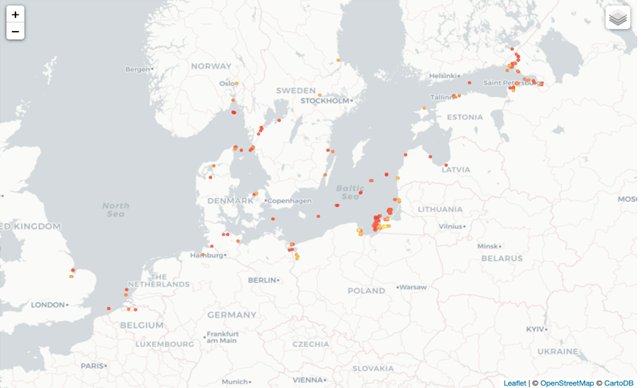
To reduce traffic noise, we only included AIS transmissions for non-NATO nation commercial vessels transponding with a speed over ground less than or equal to two knots. We then generated spatial loitering polygons which may represent ports, anchorages, or other areas where a VOI loitered during the window of research (see Figure 1). As expected, areas exhibited differing loitering densities with some being dense (depicted as yellow on Figure 1) and others less dense (depicted in red). These loitering polygons served as the basis for developing a list of VOIs using their MMSI identification numbers as unique identifiers.
Matching loitering isopleths with the original AIS transmissions used to generate them yielded a ship-to-loitering location table (see Table 1) with a ship’s unique identifier, the AIS message date and time, and the loitering polygon identity.
| MMSI | Date-time | Polygon |
| 123456789 | T=1 | Polygon A |
| 987654321 | T=1 | Polygon A |
| 123456789 | T=2 | Polygon B |
| 123456789 | T=3 | Polygon C |
Table 1. Sample ship-to-loitering location table
From this table, we extracted a location-to-location network where loitering areas were interconnected if a VOI traveled from one location to the other location. Next, to examine the underlying organizations linked to the VOIs, the team gathered open-source information on the companies who own and/or operate these ships using the Lexis Nexis Advance Research Database. This corporate information was then joined to the ship data. The corporate information was used to create connections between companies if they were tied to the same ship, one was a subsidiary of the other, one had a major financial stake in the other, shared the same physical address, or had members of their boards of directors in common. The findings and analysis of these data follow in the subsequent section.
Analysis: Shedding Light on Gray Maritime Networks
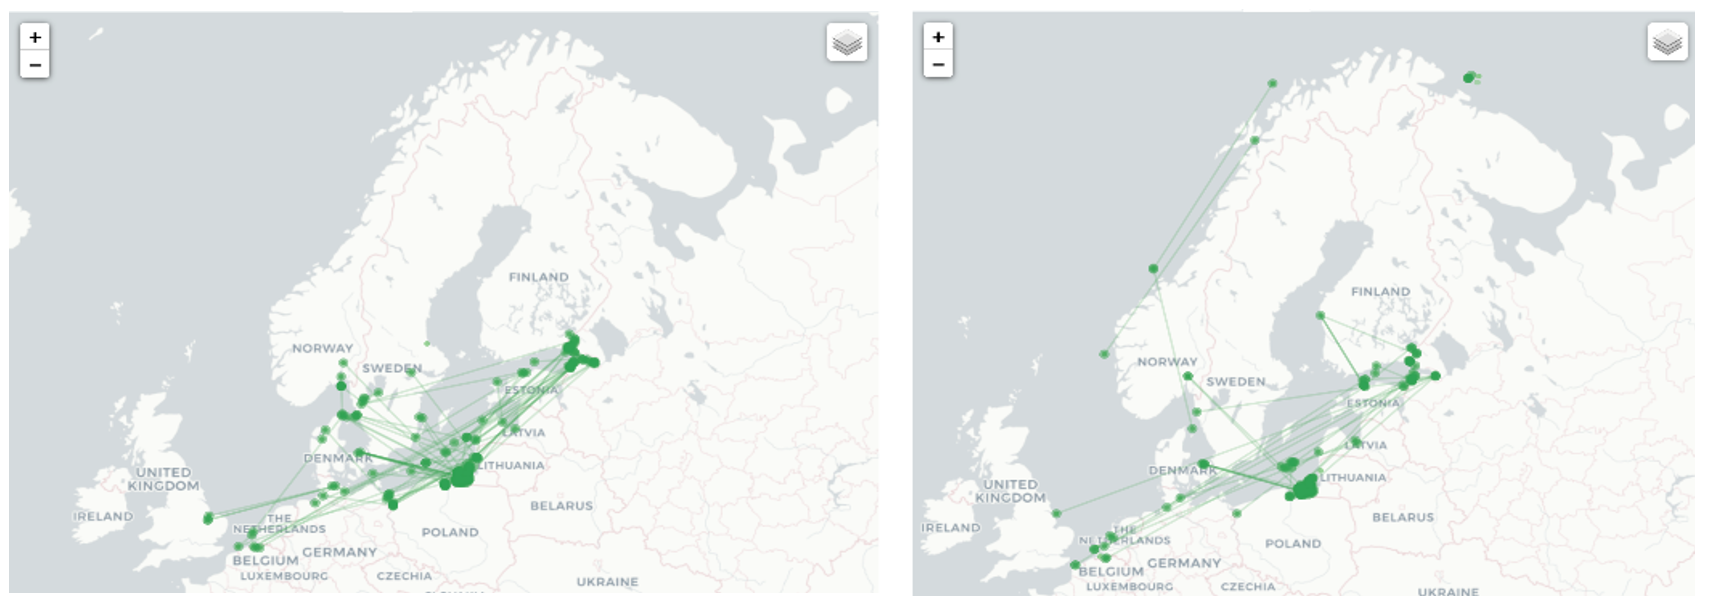
From the AIS data on ship movements we extracted two networks for further analysis: the location-to-location network composed of loitering areas observed during BALTOPS (31 May 2018 through 16 June 2018) and loitering areas observed during Operation Trident Juncture (22 October 2018 through 25 November 2018). Most of the VOI activity was concentrated within the Baltic Sea (see Figure 2). These findings are to be expected considering the geographic range of operations. While most VOIs in the sample set remained in the Baltic Sea, a few were also observed loitering off the coast of Norway during NATO exercise Trident Juncture.
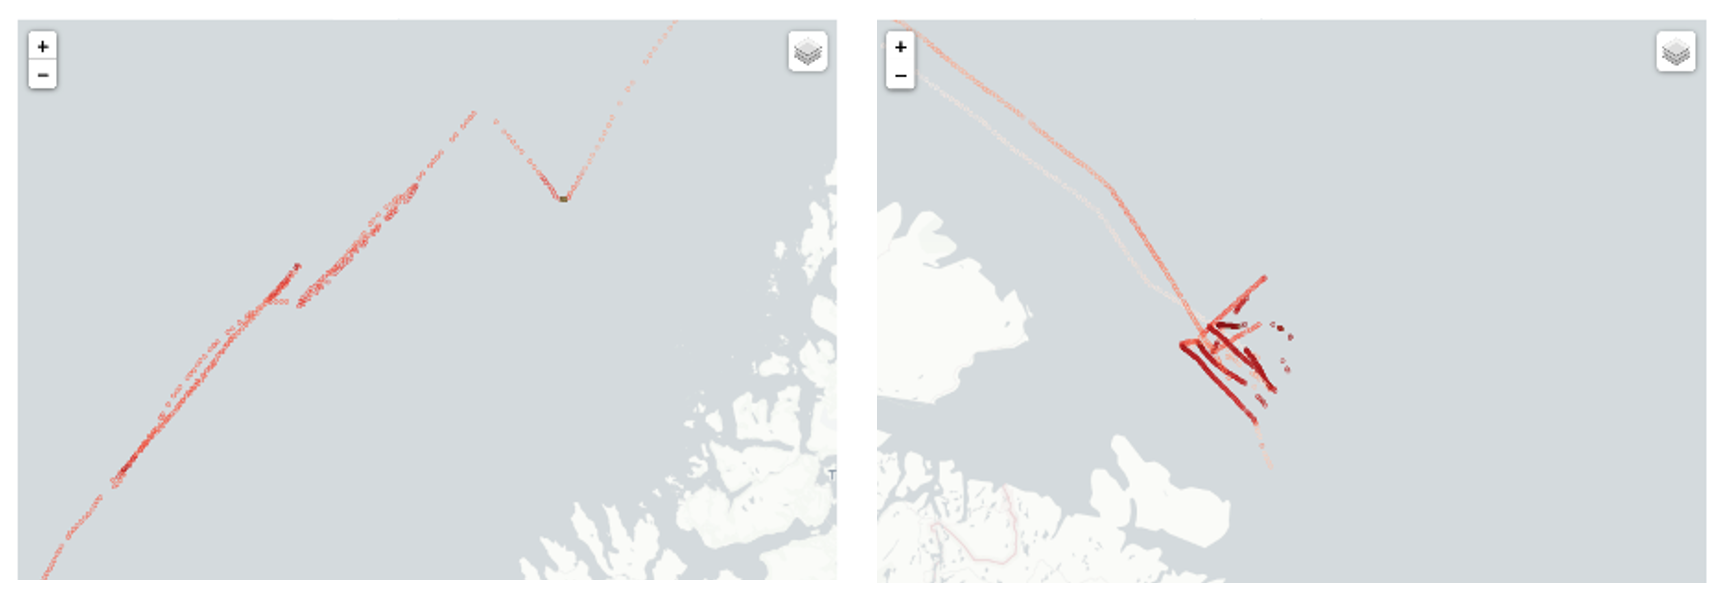
Upon closer examination, the VOIs active off the coast of Norway during Trident Juncture appear to have loitered near sensitive military locations and displayed abnormal movement patterns. For instance, Figure 3 illustrates the movements of two VOIs with abnormal tracking patterns. The first is an oil tanker owned by the Russian government and operated by a registered shipping company in that country. The second is a commercial chemical products tanker registered in the Marshall Islands, a country often used as a flag of convenience, shown loitering north of Norway.
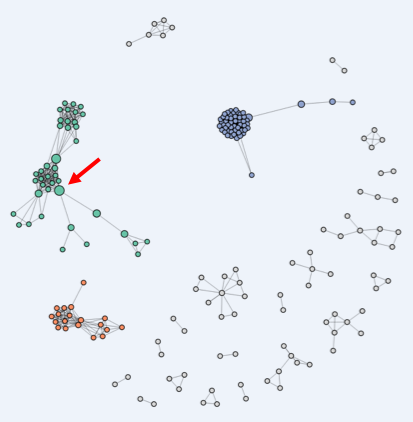
Finally, Figure 4 is a network representation of connections between the companies associated with identified VOIs. In this graph, we see that many of the companies are related to each other, with the three largest components colored in blue, green, and orange. For instance, the large blue cluster on the right-hand side of the sociogram contains many small companies, all operating from the same address in northern Russia, each with connections to at most a few ships. The large orange component on the bottom left contains clusters of VOI-associated companies interconnected by sharing some of the same board members. In the green component, shipping companies associated with VOIs are connected by sharing parent, subsidiary, or holding companies. Companies occupying an apparent position of structural brokerage are depicted by larger nodes. One such shipping company (highlighted with an arrow), for instance, was connected to the broader family of like-companies, while also being linked to a large multinational oil company through partial ownership ties (Schelle, 2018).
 Conclusions and recommendations for further research
This analysis highlights the value of NA in real-time awareness and tracking of stakeholders associated with suspected gray maritime activities in a strategic era of great power competition. Using commercially available geospatial data, our team identified 56 VOIs loitering in areas proximal to NATO-led exercises in the Baltic Sea and North Atlantic. These vessels were then linked to over 196 state-owned and private companies/entities. Analysis such as this provides insight into a network of stakeholders that may support hybrid warfare, or so-called grey-zone activities, not directly attributable to a specific nation.
The use of the network analysis methodologies discussed here and the tools developed at the Naval Postgraduate School to identify, map, and track gray maritime networks can be applied to any number of threats. While our earlier research into Chinese reef enhancement activity in the South China Sea has already been cited, Maritime Operations Center (MOC) operators and MDA analysts could adapt this toolset to track and assess maritime and terrestrial networks associated with narcotics trafficking, terrorism, Illegal and Unregulated Fishing (IIU), arms and human trafficking, and other security concerns. Integrating these tools into existing MDA systems would also provide for enhanced awareness of how these networks overlap in multiple geographic areas and in malign activities. Further, and perhaps most significantly, they could provide operators timely and actionable information.
Our research is not without room for improvement. Future iterations of this work should include a richer dataset of state/corporate linkages. This should include a deeper dive into state-sponsored (and military supported) parent-subsidiary company relationships and board memberships, or proximal geographic associations among companies, offices, and ships. Further research is also being considered through the application of system dynamics modeling, wargaming, campaign analysis, and discrete events modeling.
Acknowledgment
The authors would like to acknowledge that this research benefited immensely from the partnership between the Common Operational Research Environment (CORE) Lab and Littoral Operations Center at the Naval Postgraduate School, with the Norwegian Defense Research Establishment (Forsvarets Forskningsinstitutt, FFI). This research builds on a joint effort to integrate network analysis methodologies into the maritime domain, which won the 2019 NCI Agency’s Defense Innovation Challenge aimed at accelerating technological solutions in support of NATO C4ISR and cyber capabilities.
With more research and interest, these methods can help us better understand the non-linear relationships and feedback mechanisms that contribute to the complexity of great power competition and its manifestations in the maritime domain.
Chris Callaghan is a Research Associate in the Defense Analysis Department’s CORE Lab at the NPS. His work leverages open-source data analytics for understanding and modeling a variety of national and homeland security problems.
Rob Schroeder is a Faculty Associate for Research in the CORE Lab within the Defense Analysis Department and a PhD Student in the Information Sciences Department at the Naval Postgraduate School (NPS). He is currently researching how to use open-source information gathered largely from social media in order to understand and map the changing dynamics in conflict areas and exploring the use of network analysis to analyze maritime traffic patterns. He has presented some of this research at conferences (INFORMS and INSNA).
Dr. Wayne Porter, CAPT, USN (ret.) is a Senior Lecturer in the Defense Analysis and Systems Engineering Departments of the Naval Postgraduate School, where he also serves as Co- Director of the CORE Lab and Director of the Littoral Operations Center. He holds a Ph.D in Information Sciences and two Masters of Science degrees – in Computer Science and Joint C4I Systems Technology – from the Naval Postgraduate School. Military duty included Japan, England, Italy, the Balkans, Bahrain (COMFIFTHFLT ACOS Intelligence and MOC Deputy of Operations in the Persian Gulf/East Africa), and three tours on the personal staff of ADM Mike Mullen, including Special Assistant for Strategy to both the Chief of Naval Operations (N00Z) and Chairman of the Joint Chiefs. He subsequently served as Chair, Systemic Strategy and Complexity at Naval Postgraduate School in Monterey, California and retired from the Navy in July 2014 after 28 years of active service. Dr. Porter has contributed to a number of DoD and USN Strategy projects, including serving as systems analyst for the SECNAV’s Strategic Readiness Review.
The views expressed in this paper are those of the authors and do not reflect the official position or policies of the United States Navy or the Department of Defense.
Endnotes
1. The opaque area in which illicit of malign activity co-exist with licit activity.
2. An analytical method for interactively curating and querying relational databases (Cunningham, Everton, & Murphy, 2016). In a link diagram, different types of entities (e.g., ports, events, ships, operators, and personnel to name a few) are tied to each other explicitly with the goal of describing the environment.
3. Those operating overtly and legally.
4. All collected AIS logs were encoded in AIVDM (data received from other vessels)/AIVDO (own vessel information) sentences and required decoding for further analysis.
References
Cunningham, D., Everton, S. F., & Murphy, P. (2016). Understanding Dark Networks: A strategic framework for the use of social network analysis. Lanham: Rowman & Littlefield.
Ducruet, C., & Lugo, I. (2013). Structure and dynamics of transportation networks: models, methods and applications. In J. Rodrigue, T. Notteboom, & J. Shaw, The SAGE Handbook of Transport Studies (pp. 347-364). London: SAGE Publications, Ltd. Retrieved from: http://sk.sagepub.com/reference/hdbk_transportstudies/n20.i1734.xml
Ducruet, C., Rozenblat, C., & Zaidi, F. (2010). Ports in multi-level maritime networks: evidence from the Atlantic (1996-2006). Journal of Transport Geography, 18(4), 508-518. Retrieved from: https://www.sciencedirect.com/science/article/abs/pii/S0966692310000372
Dupont, B. (2014). Skills and Trust: A Tour Inside the Hard Drives of Computer Hackers. In C. Morselli, Crime and Networks (pp. 195-217). New York, N.Y.: Routledge. Retrieved from: https://papers.ssrn.com/sol3/papers.cfm?abstract_id=2154952
Krebs, V. E. (2002). Mapping networks of terrorist calls. Connections, 8(2), 43-52. Retrieved from: http://citeseerx.ist.psu.edu/viewdoc/download?doi=10.1.1.192.4165&rep=rep1&type=pdf
LexisNexis. (2019, 09 01). Lexis advance research. Retrieved from LexisNexis: https://advance.lexis.com/
Lyons, A., Turner, W., & Getz, W. (2013). Home range plus: A space-time characterization of movement over real landscapes. BMC Movement Ecology, 1(2), . Retrieved from: https://movementecologyjournal.biomedcentral.com/articles/10.1186/2051-3933-1-2
Morselli, C., & Petit, K. (2007). Law-enforcement disruption of a drug importation network,. Global Crime, 8(2), 109-130. Retrieved from: https://www.tandfonline.com/doi/full/10.1080/17440570701362208
Papachristos, A., Hureau, D., & Braga, A. (2013). The Corner and the Crew: The Influence of Geography and Social Networks on Gang Violence,. American Sociological Review, 78(3), 417-447. Retrieved from: https://journals.sagepub.com/doi/10.1177/0003122413486800
Porter, W., Schroeder, R., Callaghan, C., Barreto, A., Bussell, S., Young, B., . . . von Eiff, J. (2019). Mapping Gray Maritime Networks. Connections, 39(1). Retrieved from: https://www.exeley.com/connections/doi/10.21307/connections-2019-006
Raab, J., & Milward, H. B. (2003). Dark networks as problems. Journal of Public Adminstration Research and Theory, 13(4), 413-439. Retrieved from: https://arizona.pure.elsevier.com/en/publications/dark-networks-as-problems
Rivers, R., Evans, T., & Knappett, C. (2016). From oar to sail: The role of technology and geography in the evolution of Bronze Age Mediterranean networks. In C. Ducruet, Maritime Networks: Spatial structures and time dynamics(pp. 63-76). New York: Routledge.
Roberts, N., & Everton, S. (2011). Strategies for Combating Dark Networks. Journal of Social Structure, 12(2). Retrieved from: https://www.cmu.edu/joss/content/articles/volume12/RobertsEverton.pdf
Rodrigue, J., & Notteboom, T. (2014). The geography of cruises: itineraries, not destinations. Applied Geography, 38(1), 31-34. Retrieved from: https://www.sciencedirect.com/science/article/abs/pii/S0143622812001373?via%3Dihub
Schelle, S. (2018). Kartlegging av maritime hybride trusler: Kan bruk av stordata og sosial nettverksanalyse bidra til økt maritim situasjonsbevissthet? [Survey of maritime hybrid threats: Use of big data and social network analysis to help increased maritime situational awareness?]. Retrieved May 06, 2020, from https://fhs.brage.unit.no/fhs-xmlui/bitstream/handle/11250/2583966/2018%20Masteroppgave%20Schnelle%20Stian.pdf?sequence=1
Wallace, T., & Mesko, F. (2013, September 30). The Odessa Network: mapping facilitators of Russian and Ukrainian Arms Transfers. Retrieved 09 2019, from C4ADS.org: https://static1.squarespace.com/static/566ef8b4d8af107232d5358a/t/56af8a2dd210b86520934e62/1454344757606/The+Odessa+Network.pdf
Wang, L., Notteboom, T., & Yang, L. (2016). British and Japanese Maritime Networks in China in the 1920s. In C. Ducruet, Maritime Networks: Spatial structures and time dynamics (pp. 112-133). New York: Routledge.
Featured Image: OSLO, Norway (Nov. 13, 2018) Sailors and Marines man the rails as the Wasp-class amphibious assault ship USS Iwo Jima (LHD 7) arrives in Oslo, Norway, for a scheduled port visit Nov. 13, 2018. (U.S. Navy photo by Mass Communication Specialist 3rd Class Daniel C. Coxwest/Released)
Discover more from Center for International Maritime Security
Subscribe to get the latest posts sent to your email.
Wayne – A very interesting research approach and outcomes. Have you had any interest outside of NPS to apply your method to a specific problem? Thank you. Bill