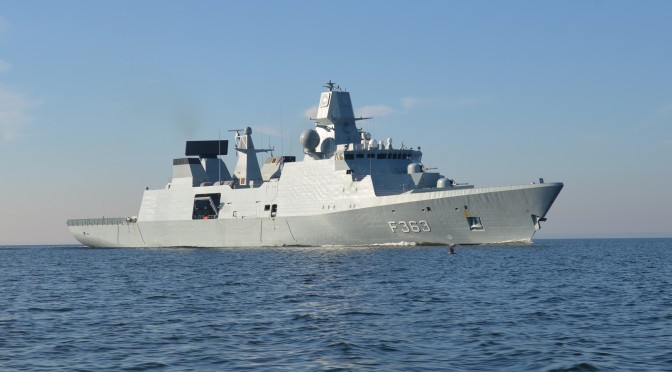
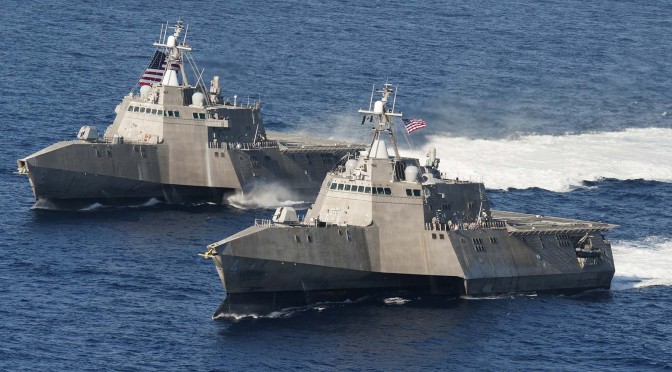
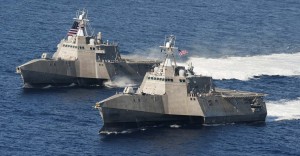
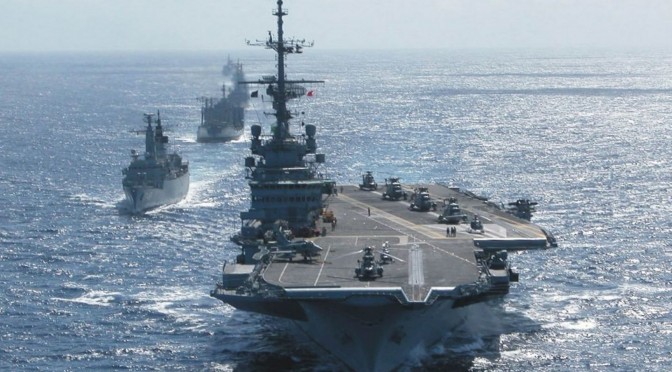
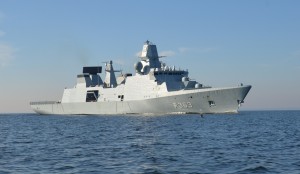
 Many critics have assailed the Littoral Combatant Ship (LCS) program for its high cost in comparison with foreign, supposedly better armed and equipped equivalents. The Danish Iver Huitfeldt and Absalon class frigates are often cited as examples of cheaper, more capable small combatants in comparison with LCS. These claims are not well researched and are based on isolated points of data rather than any systemic analysis. Other nations may be able to build relatively cheap warships, but hidden factors not discussed by critics, rather than U.S. shipbuilding and general acquisition deficiencies make this possible. The Danish Navy, in conjunction with corporate giant A.P. Moeller have produced an outstanding series of warships, but a direct comparison between them with the LCS is one of apples verses oranges. It’s time to stop using this inaccurate strawman argument against LCS.
[otw_shortcode_button href=”https://cimsec.org/buying-cimsec-war-bonds/18115″ size=”medium” icon_position=”right” shape=”round” color_class=”otw-blue”]Donate to CIMSEC![/otw_shortcode_button]
The direct comparison of the Danish frigates to LCS is highly misleading due to significant differences in Danish shipbuilding practice and financial accounting. The Danish “StanFlex” system of “plug and play” weapons, sensors and equipment (including cranes!) officially separates these components from the advertised cost of the ship. A 2006 RAND report on the rise in warship costs specifically identified such systems as the principal drivers of warship cost inflation. The Danish concept of separating these more costly systems from their hull gives the appearance of a much less expensive warship. The ships were often accepted by the Danish Navy in an incomplete condition. The Danish Nils Juel, for example, was delivered in 2014 with 76mm guns scavenged from decommissioned ships. Danish figures suggest that the Iver Huitfeldt program used $209 million in reused equipment from scrapped vessels. Reuse, however, could not meet all system requirements. The planned 127mm (5 inch) gun system was deemed too expensive at $50 million a copy. The ship’s close-in weapon system mount was actually a dummy, wooden weapon due to a lack of certification. While equipped with a MK 41 vertical launch missile system (VLS), the ship deployed to the fall 2014 U.S. Bold Alligator exercise without the system certified for use or weapons purchased for eventual outfitting. That same reporting indicated that the ship was delivered with its damage control system incomplete and lacking a secondary steering control center. Much of the ship is built to merchant ship standards which are not as robust as those traditionally provided to warships. In addition, the Danish ship was forced to take on nearly 20 extra crew members when the lean 100 person complement was found insufficient for operational needs.
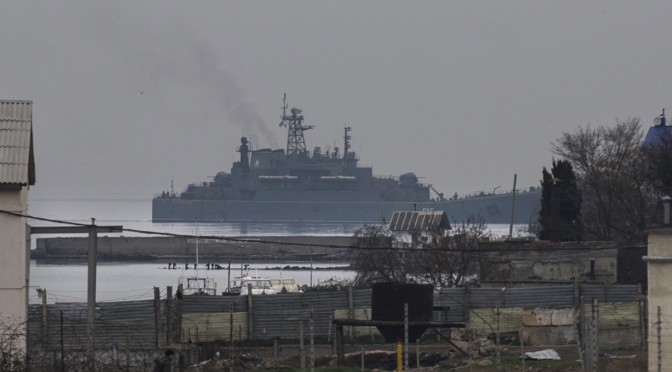
The Absalon class is more akin to a heavily armed, limited load amphibious ship rather than a surface combatant. It combines a number of warfare and expeditionary capabilities on a single hull, but excels at none of them. It is also significantly slower (at 24 knots maximum speed) than most other surface combatants. Both Absalon and her sister Esbern Snare were also delivered without their full installation of weapons and sensors. In the case of Absalon, this process took over three years. The Danish Navy has been open in regards to these conditions. U.S. advocates of adopting the Absalon or Iver Huitfeldt classes almost always overlook them.
The LCS, by contrast is delivered with significant systems such as its 57mm gun and point defense missile system incorporated into the overall cost. Scavenging of weapons from previous U.S. ships is extremely difficult due to a constant process of upgrades over time. Weapon systems, like ships also have service lives and U.S. ships being decommissioned often have equally aged weapons and supporting electrical, hydraulic and mechanical systems that make a re-installation not cost effective. Unlike the Absalon class which is not equipped to master any one warfare area in any of its configurations, the LCS can be exclusively equipped to master one such discipline. It is purposely designed to operate in tailored flotillas designed to mitigate the risks incurred by one ship like Absalon. Critics often fail to note that both Iver Huitfeldt and Absalon are nearly twice the size of LCS. Neither has the speed requirements that drove initial LCS design considerations. The size difference alone may explain the Danish ships’ much longer endurance. These differences in Danish and U.S. practices make comparisons difficult at best.
Finally, the Danish Navy contracted the building of both the Iver Huitfeldt and Absalon classes to a single firm, the A.P. Moeller Corporation. This multinational giant derives the vast bulk of its earnings from the more stable commercial market and its warship business is not dependent on government orders, which causes instability and cost overruns in its production process. By contrast, U.S. LCS shipbuilders Lockheed Martin and Austal serve government interests much more than private ones and are more dependent on government contracts to maintain stability in their operations. The 2006 RAND report also identified this process of divided warship construction as another factor in the increased cost of surface combatants.
The LCS program has been beset with a number of technological and systemic problems since its inception that have slowed the program’s progress and likely contributed to some cost overruns. On the surface, the Iver Huitfeldt and Absalon class frigates would appear to be cost effective alternatives to the LCS. Deeper investigation, however, reveals how the Danes achieved these substantially lower figures by separating higher cost equipment from that of the platform, scavenging weapons from decommissioned ships, accepting incomplete warships for service, and purchasing these vessels from a single, robust commercial shipbuilder not dependent on or affected by unstable government ship acquisition processes. In summary, these classes meet Denmark’s needs, but are an unsuitable substitute for U.S. Navy small combatants. LCS critics, however, should not use the Danish ships as strawman LCS substitutes. It is a most unequal comparison.
Steve Wills is a retired surface warfare officer and a PhD student in military history at Ohio University. His focus areas are modern U.S. naval and military reorganization efforts and British naval strategy and policy from 1889-1941.
[otw_shortcode_button href=”https://cimsec.org/buying-cimsec-war-bonds/18115″ size=”medium” icon_position=”right” shape=”round” color_class=”otw-blue”]Donate to CIMSEC![/otw_shortcode_button]

