Tag Archives: featured

American Strategy in the 21st Century: Maritime Power and China – Part II

This is the second of a three-part series. See Jake’s first article here.

China is a Land Power
While China continues to invest heavily in a navy, it still remains a continental for several reasons. First, China must maintain a large land force for internal stability and as a deterrent to regional competitors such as India, Vietnam and Russia. It faces demographic, economic and social challenges which threaten the Communist Party’s grip on power. Bernard D. Cole states, “Economic priorities and the need to defend the world’s longest land border with the most nations … still argue against [the PLA(N)’s] ambition for a global navy.”[1] That being said, China continues to develop a navy capable of meeting security interests within the first island chain and most of the South China Sea up to 1,000 nm off the coast.

Second, while China has vastly improved “blue water” capabilities, it has not yet capable of protecting maritime interests beyond the first island chain. Investing heavily in “anti-access/area denial” (A2AD) capabilities is a defensive strategy designed to make the cost of U.S power projection too high. However, A2AD is not a sea control strategy. It does little to prevent the cumulative effect[2] of American (and allied) maritime power to strangle China beyond the first island chain, as outlined by Thomas Hammes.[3] Finally, China’s substantial investment in a navy will likely lead to organizational pressure not to risk it to heavy losses, something which Arquilla and others have also noted. [4]

“Quantity has a quality of its own,” and China will enjoy early numerical superiority against forward-deployed American forces. It would take two to three weeks for additional forces to reach the Western Pacific in the event of an unexpected crisis. A comparison of the PLA(N) and forward deployed American naval forces is found below.
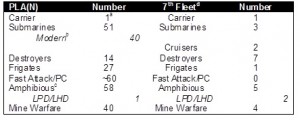
Figure 1. 2012 Comparison of PLA(N) and U.S. 7th Fleet Derived from China Naval Modernization (2012)  a-CV 16 “Liaoning”, while commissioned, does not have a carrier air wing. b-Does not include “Jin” class SSBN or “Ming” class SS c-Derived from Table 4, pg. 41 of China Naval Modernization (2012) d-U.S. 7th Fleet derived from public information available at http://www.c7f.navy.mil/forces.htm
Figure 1. 2012 Comparison of PLA(N) and U.S. 7th Fleet
Derived from China Naval Modernization (2012) [5]
a- CV 16 “Liaoning”, while commissioned, does not have a carrier air wing.
b- Does not include “Jin” class SSBN or “Ming” class SS
c- Derived from Table 4, pg. 41 of China Naval Modernization (2012)
d- U.S. 7th Fleet derived from public information available at http://www.c7f.navy.mil/forces.htm
Noting the numerical superiority of the PLA(N) over local American forces, the PRC may miscalculate on American resolve (or that of allies such as Japan and South Korea) and initiate a conflict.

Also, while the U.S. has not fought a traditional fleet action since World War II, the Navy has been conducting combat operations around the globe for the past two decades. China, for all the investment and exercises, has not engaged in maritime combat since 1988 in the Spratly Islands with Vietnam. PLA(N) commanders may assume their combat capabilities are better than they actually are, providing unfounded assurance to their own political leadership, increasing the odds of miscalculation.

American Maritime Power and the Strategy to Defeat China
America’s super power status is preserved through the ability to project power across the oceans. While the most obvious component of maritime power is the Navy, it is in jointness with the land, air, space and cyberspace components that makes it formidable. The “pivot” to the Asia-Pacific region must include a reallocation of forces and capabilities. China has continued to aggressively pursue territorial disputes, which have had the effect of driving many Asian countries to seek a greater American presence in the region. A larger land presence is out of the question, but naval and air assets – especially airborne ISR platforms – are much less intrusive and appealing. Space and cyberspace will play a significant (perhaps decisive) role, not only in sensor capabilities but also in defeating A2AD systems and PRC ISR.

The core of American maritime power is built upon destruction of enemy naval forces while preserving its own. Around this core are five pillars: scouting effectiveness, long-range strike, logistics and supply, amphibious assault and coalition warfare.

The Core – Sea Combat and Survivability
The ability to destroy or render inoperable the enemy’s navy – on the surface, in the air or under the sea – is the sine qua non of maritime power. At the same time, the survivability of forces enables the Navy to follow up on success and execute further operations, such as additional combat, blockade, escort or other sea control/sea denial tasks. The introduction of amphibious forces also requires sea combat and may be undertaken in contested waters. A maritime war with China will pit numerically inferior American forces against a formidable yet untested larger PLA(N). U.S. forces must be able to fight, win and survive to carry the war closer to China’s shores.

The Pillars
Scouting effectiveness. Wayne Hughes defines scouting as “the gathering and delivery of information,” a more compact and encompassing term than the currently used “ISR.”[6] It also includes the processing and analysis of vast quantities of all-source information – including space and cyberspace – to provide commanders the best picture possible from which they can make timely decisions. Scouting effectiveness is judged by how quickly information can be turned into actionable intelligence. If commanders can remain inside the decision-making loop of their enemy, they can have a distinct advantage.

Long-range strike. American military development continues to pursue the goal of projecting power from extreme distances or from a position of stealth or sanctuary. Long-range strike should be thought of as a “family of systems,” including land-based bombers, carrier-based strike aircraft (manned and unmanned), rail guns, cruise missiles and supporting airborne electronic attack aircraft.[7] The ability to strike the PRC’s A2AD systems, which are located not only on the coast but also far inland, will be crucial in a maritime fight. In this case, space and cyberspace offensive operations should also be considered in the family of “long range” strike.

Amphibious assault. War is ultimately decided by the “man on the scene with a gun.” The ability to insert land forces onto hostile shores in contested seas may be the ultimate arbiter in a maritime conflict with China, especially in the scenario described above. Even if not used immediately, the credible threat of an amphibious landing could have the effect of tying down Chinese naval, land and air forces hundreds of miles away.

Logistics and supply. In a conflict with China, we should expect that forward supply bases such as those in Japan, South Korea and Guam will become targets, along with supply ships. The flow of food, fuel, forces and ammunition will be the determining factor in our ability to sustain a long-term conflict, so our defense of “sea lanes of communication” (SLOCs) will be tested. Concurrently, the ability to restrict or deny China’s SLOCs should be an early objective of operational planning. A prolonged conflict will test both American and Chinese logistical capacity. The longer America is able to sustain a conflict while controlling SLOCs, the more untenable the Chinese position becomes.

Coalition warfare. The scenario we introduced highlights the importance of coalition and allied warfare. From a perspective of legitimacy, American national security policy has largely adopted the position that the unilateral use of force, while retained, is undesirable. World, and more importantly American, public opinion matters significantly in our ability to conduct and sustain military operations. More importantly, the participation of allies is necessary to offset the quantitative advantages of the PLA(N). The Japan Maritime Self-Defense Force (JMSDF) and the Republic of Korea Navy (ROKN) are significant forces in their own right, and combined with the U.S. Navy, would match up well against the PLA(N). Third, while some of our coalition partners and allies such as the Philippines, Thailand, Australia, New Zealand or Singapore may not directly participate, they may provide critical logistical hubs or basing. The pillars described above – scouting effectiveness, long-range strike, amphibious assault and logistics and supply – will hinge on the participation and/or support of our allies and friends.

Preparing to Pivot – Restructuring Forward Deployed American Forces
Former Secretary of Defense Leon Panetta suggested that approximately 60 percent of the U.S. naval forces will be postured toward the Pacific region by 2020. How those forces are configured remains a central question.[8]
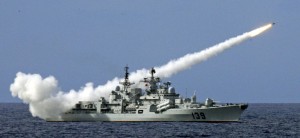
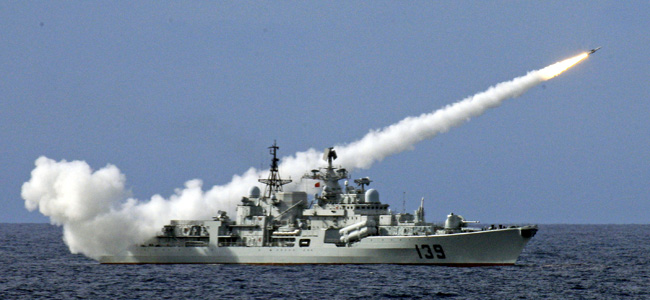
A Chinese warship launches a missile during a live-ammunition military drill held by the South China Sea Fleet last year.

Current maritime forces are centered on the USS George Washington carrier strike group and a large amphibious task force, CTF 76. The Air Force, Army, Marines and special forces also have a significant presence in the region in Japan, South Korea and Guam.

Future force realignment in the region should include an increase in the number of forward deployed U.S. submarines. The immediate availability of subsurface assets would tip the balance against the numerical advantage of the PLA(N) and allow commanders the option to operate immediately in the first island chain without risking large surface combatants.

In that vein, the development and construction of small fast and stealthy surface missile combatants would provide another avenue to commanders for operations closer in to Chinese waters.[9] Significant investment has already been made in both the littoral combat ship (LCS) and joint high speed vessel (JHSV), which represents a starting point. If equipped with next-generation anti-ship cruise missiles (ASCM’s) such as the Harpoon Block III, advanced capability (ADCAP) torpedoes and SM-2 missiles, these surface combatants could sortie into the East China and Yellow Seas conducting “hit and run” attacks on the PLA(N) surface units as well as protect Japanese and Korean home waters. Further out from the first island chain, they can also be utilized from the Philippines to the Spratly Islands and Singapore to participate in off-shore blockade of the Malacca strait.

Much like the Navy, the Air Force will operate at a numerical disadvantage to the Chinese air and naval air forces. It will fight further from bases, requiring tanker support making them vulnerable and limiting their attack depth. Both the Navy and Air Force will depend on advantages in electronic warfare to blind China’s air forces and air defense systems while fifth generation stealth fighters, such as the F-22, will be critical to achieve air superiority.

Land forces in a maritime conflict are naturally built around maritime assault. However, the presence of a significant force on the Korean peninsula serves as both a deterrent to North Korea attempting to take advantage of a conflict as well as representing a pool of forces to draw from to conduct amphibious operations. Soldiers and Marines stationed on Okinawa, Guam, Korea, Japan and Australia, have to be sufficient in number to conduct a forced entry and capture of any number of island-war scenarios, whether in the tiny Spratly, Paracel or Senkaku Islands to larger ones such as Taiwan.

Land forces also have a role in our own ability to contest the seas and defeat PRC A2AD systems. They can be used to station our own ASCM capabilities among the many islands and littorals in the East and South China Seas. Coupled with land-based rail or traditional gun systems, they could provide an effective deterrence against a PLA(N) sortie and give the PRC leadership pause before initiating conflict.

The opening stages of a maritime conflict with China will be a contest of sea denial. Large American surface combatants will not be operating within the first island chain until Chinese land-based ASCM capabilities are sufficiently neutralized. Control of the undersea, air and space will be bitterly contested. The PRC will attempt to “blind” American ISR and “command and control” capabilities using cyber attacks and anti-satellite (ASAT) missile systems.

U.S. submarines will play a crucial role attriting Chinese naval forces as well as executing strikes against ports and logistic facilities. U.S. land-based and carrier aircraft will begin to contest the skies. With stealthy, fast missile boats, surface forces could sortie out into contested seas. America will not have initial sea control within the first island chain, but should pursue sea denial to limit the PLA(N)’s freedom of action.

At the same time, larger surface action groups made up of guided missile destroyers and cruisers can begin to choke off China’s economic lifelines, especially south of the Spratly Islands and in the Western Pacific. Long-range strike platforms and airborne electronic attack, coupled with space and cyberspace warfare operations, will attempt to roll back China’s formidable integrated air defense (IAD) and A2AD systems. This will create an ever-tightening grip on Chinese economic activity and achieve air superiority in areas critical to the conflict.

About the Author
LT Robert “Jake” Bebber USN is an information warfare officer assigned to the staff of the United States Cyber Command. He holds a Ph.D. in Public Policy from the University of Central Florida. The views expressed here do not represent those of the Department of Defense, Department of the Navy or the U.S. Cyber Command. He welcomes your comments at jbebber@gmail.com.

Sources

[1] Cole, Bernard D. The Great Wall at Sea: China’s Navy in the Twenty-First Century (2nd Ed). Annapolis: Naval Institute Press, 2010. Pg. 201.

[2] Wylie outlined two types of strategies: sequential and cumulative. A sequential strategy is one in which each success is built upon the other in a march toward victory. He suggests the “island hopping” campaign in the middle Pacific as an example. A cumulative strategy is “made up of a series of lesser actions” which are not “sequentially interdependent.” See pg 22-27 of Military Strategy.

[3] Hammes, T. X. Offshore Control: A Proposed Strategy for an Unlikely Conflict. Washington DC: Institute for National Strategic Studies, National Defense University, 2012.

[4] However, this risk aversion may apply only to newer, modern platforms. The PLA(N) may be more willing to sortie older surface combatants which are still heavily armed anti-ship cruise missile (ASCM) platforms

[5] O’Rourke, Ronald. China Naval Modernization: Implications for U.S. Navy Capabilities – Background and Issues for Congress. CRS Report for Congress, Washington, DC: Congressional Research Service, 2012.

[6]Wayne P. Hughes, Jr. “Naval Operations: A Close Look at the Operational Level of War at Sea.” Naval War College Review, 2012: 23-47. Pg. 32.

[7] Gunzinger, Mark A. Sustaining America’s Advantage in Long-Range Strike. Washington DC: Center for Strategic and Budgetary Assessments, 2010. Pg. ix.

[8] Neisloss, Liz. U.S. defense secretary announces new strategy with Asia. June 2, 2012. http://edition.cnn.com/2012/06/02/us/panetta-asia/index.html (accessed December 1, 2012).

[9] Huges, op cit., Pg. 29.

NATO Defense Spending, Past and Present: Part 1

Discussions and data presentations surrounding the recent NATO summit on member state spending levels on defense and the now-metronomic domestic squabbles over the United States’ own military budget have centered on the percentage of gross domestic product (% of GDP) benchmark. GDP is a hoary and problematic macroeconomic metric in its own right. Further, % of GDP offers no natural rationale for defense or any other budgetary programming, per se. Indeed, because of its fuzziness, GDP is thus dually ambiguous in its role as a primary measure of economic viability and as a stake in the ground for national planning. Is NATO’s goal to get military spending up to 2% of GDP in the coming decade plausible?  This question inspired a look at the alliance’s GDP and defense budget history.

The following essay is the first in a three-part series which together provide a macroeconomic overview of the 55 year old defense alliance. This first essay presents the history of NATO member nation defense spending since the alliance was founded in 1949. Eleven of the twelve founding members (Iceland is excluded from the analysis in this series for a lack of defense expenditure data) and four Cold War additions (Germany, Greece, Spain, and Turkey) are plotted individually because their longevity provides substantial history for member and alliance defense spending context. The twelve post-Cold War enlargement members are grouped into a single category in this first essay but are considered individually in the second and third papers.

The second paper will look a little closer at the defense spending history and trends of individual member nations and selected sub-groups. The third will examine the concept of command spending models such as setting a goal for each member to spend “2% of GDP” via a look at several other hypothetical spending models.

The source for NATO member nation defense spending for 1949-2013 is the SIPRI Military Expenditure Database. The SIPRI dataset also has a table containing most—but not all—of the expenditure data computed as a percentage of GDP. In order to fill in some of the missing information, for example for Turkey for the 1953-1959 period, an analytical dataset for member nation population and GDP was created from the Penn World, International Monetary Fund World Economic Outlook (IMF WEO), and Maddison Project datasets, using Bureau of Labor Statistics Consumer Price Index and World Bank Purchasing Power Parity conversion factor for currency conversion to a constant dollar baseline reference. All currency data in this series have been converted into 2014 U.S. dollars (US$2014).

As mentioned at the outset, “GDP” is ambiguous because it can be computed many ways according to the assumptions underlying a given dataset. The Penn World, IMF WEO, and Maddison data sets demonstrate strong correspondence in most cases where their datasets overlap but in some cases they diverge significantly. The Penn World purchasing power parity (PPP) PWT8.0 dataset was supplemented and adjusted with the other datasets and currency conversion sources to provide data for as many years of each member nation’s participation in the alliance as possible. Information on the adjusted dataset assumptions and methodology is available at this link.

The four graphs shown below present NATO member % of GDP spent on defense in direct comparison to, respectively, GDP, per capita GDP, and member share of cumulative NATO defense spending in a scatterplot format. Both horizontal and vertical axis categories are independent and the time-series/chronology is implied in the data rather than explicitly annotated (typically as the independent axis). Thus the entire history of NATO defense spending—who spent how much historically—is available at one glance.

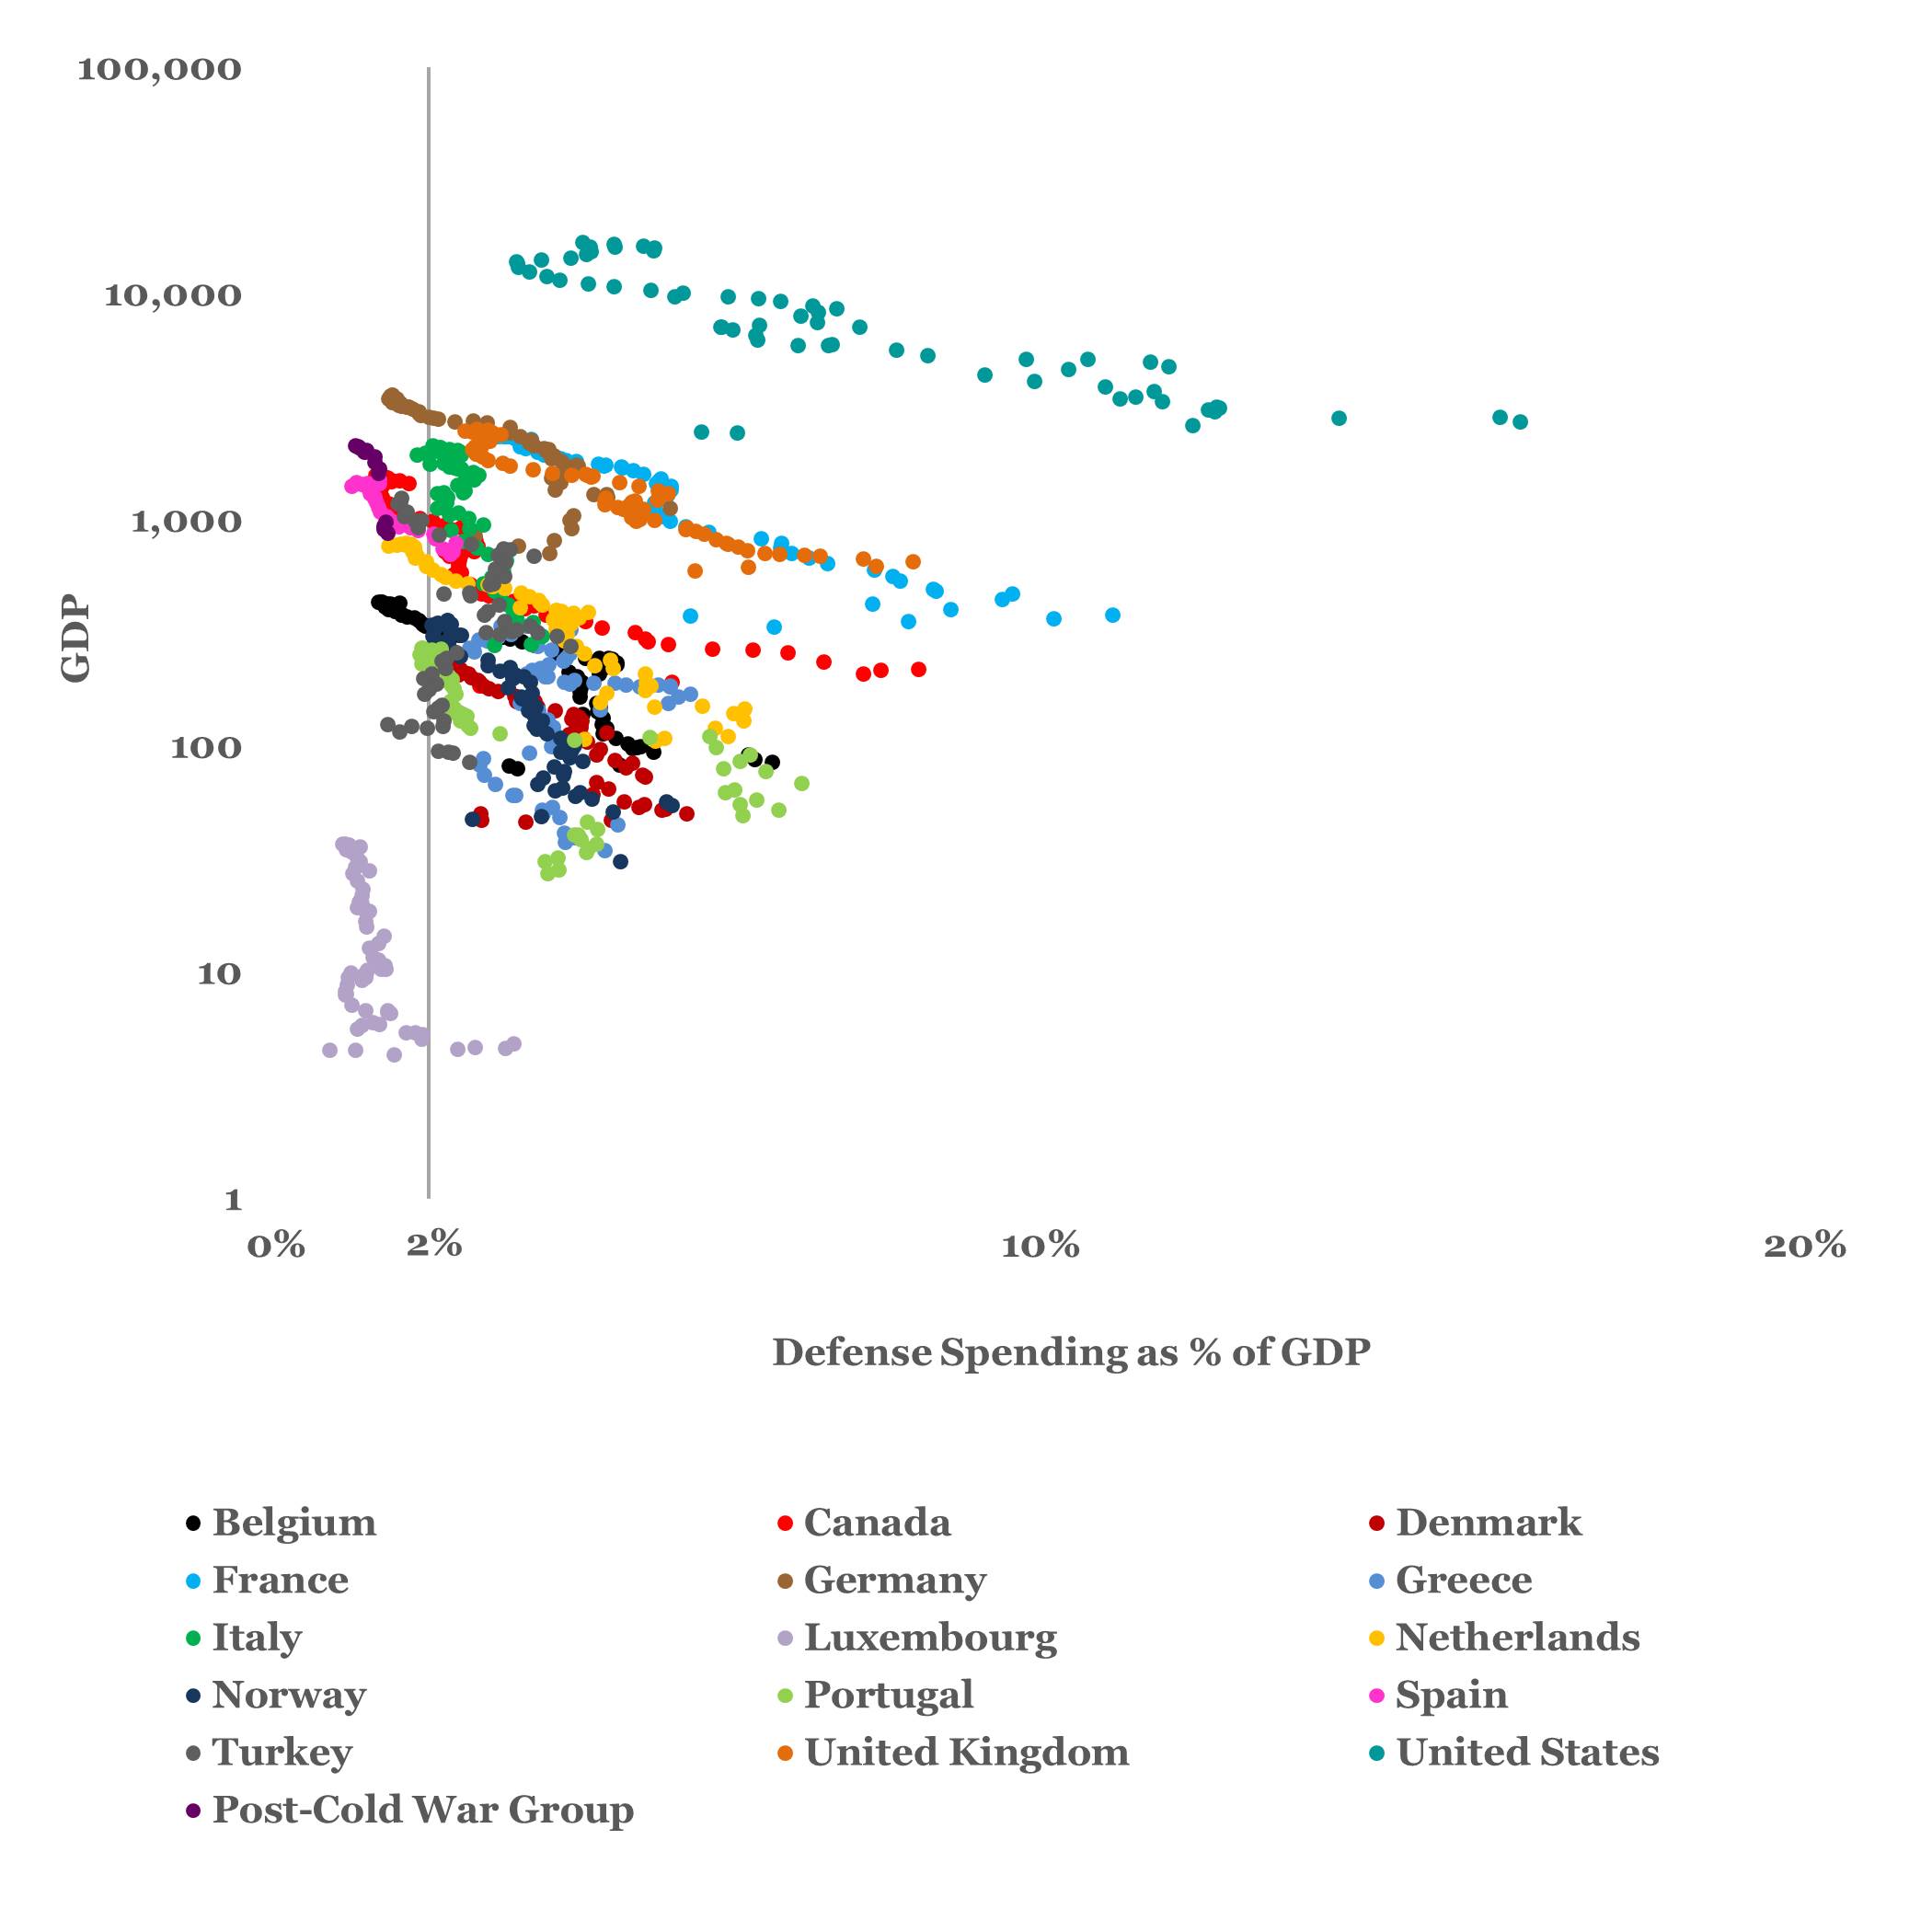
The first graph shows % of GDP verses GDP. Although specific years are not listed, we can infer approximate chronology from the knowledge that constant dollar GDP has generally grown since 1949. Thus, the more recent years are found higher up the vertical logarithmic axis. The basic pattern is a right hook: as a member’s GDP rose, % of GDP spent for defense typically decreased, though, in some cases, there are notable abrupt shifts, as can most noticeably be seen in the last dozen dots for the United Kingdom (dark orange) and the United States (aqua). These shifts to higher % of GDP spending on defense reflect these nations’ budgetary adjustments to the wars of the past decade.

nato_defspnd_part1_img1-1_mbrgdp_v_pergdpMember defense spending as % of GDP v. member GDP (billions)

The second graph plots % of GDP against per capita GDP. This chart in particular illuminates at least one problematic aspect of a %-of-GDP basis for defense spending when per capita national affluence, rather than aggregate national affluence, is emphasized. One may ask why if %-of-GDP is an admittedly arbitrary but plausible defense spending goal, wouldn’t a progressive per capita defense spending rate be more in line with most modern taxation models? Hypothetically, should those individuals who make more, and presumably benefit more from NATO security, perhaps pay more? This and several similar questions about hypothetical defense spending models are briefly examined in the third essay.

nato_defspnd_part1_img1-2_mbrpercapgdp_v_pergdpMember defense spending as % of GDP v. member per capita GDP (thousands)

The second graph shows that defense spending has congregated in the low single digits of % of GDP as per capita GDP has risen. However, several long-serving members have remarkably vertical %-of-GDP defense spending trends: Italy (Kelly green), Luxembourg (lavender), Spain (pink), and Turkey (dark grey) have remained within a relatively tight bracket of from 1-4% of GDP for defense spending throughout their history in the alliance.

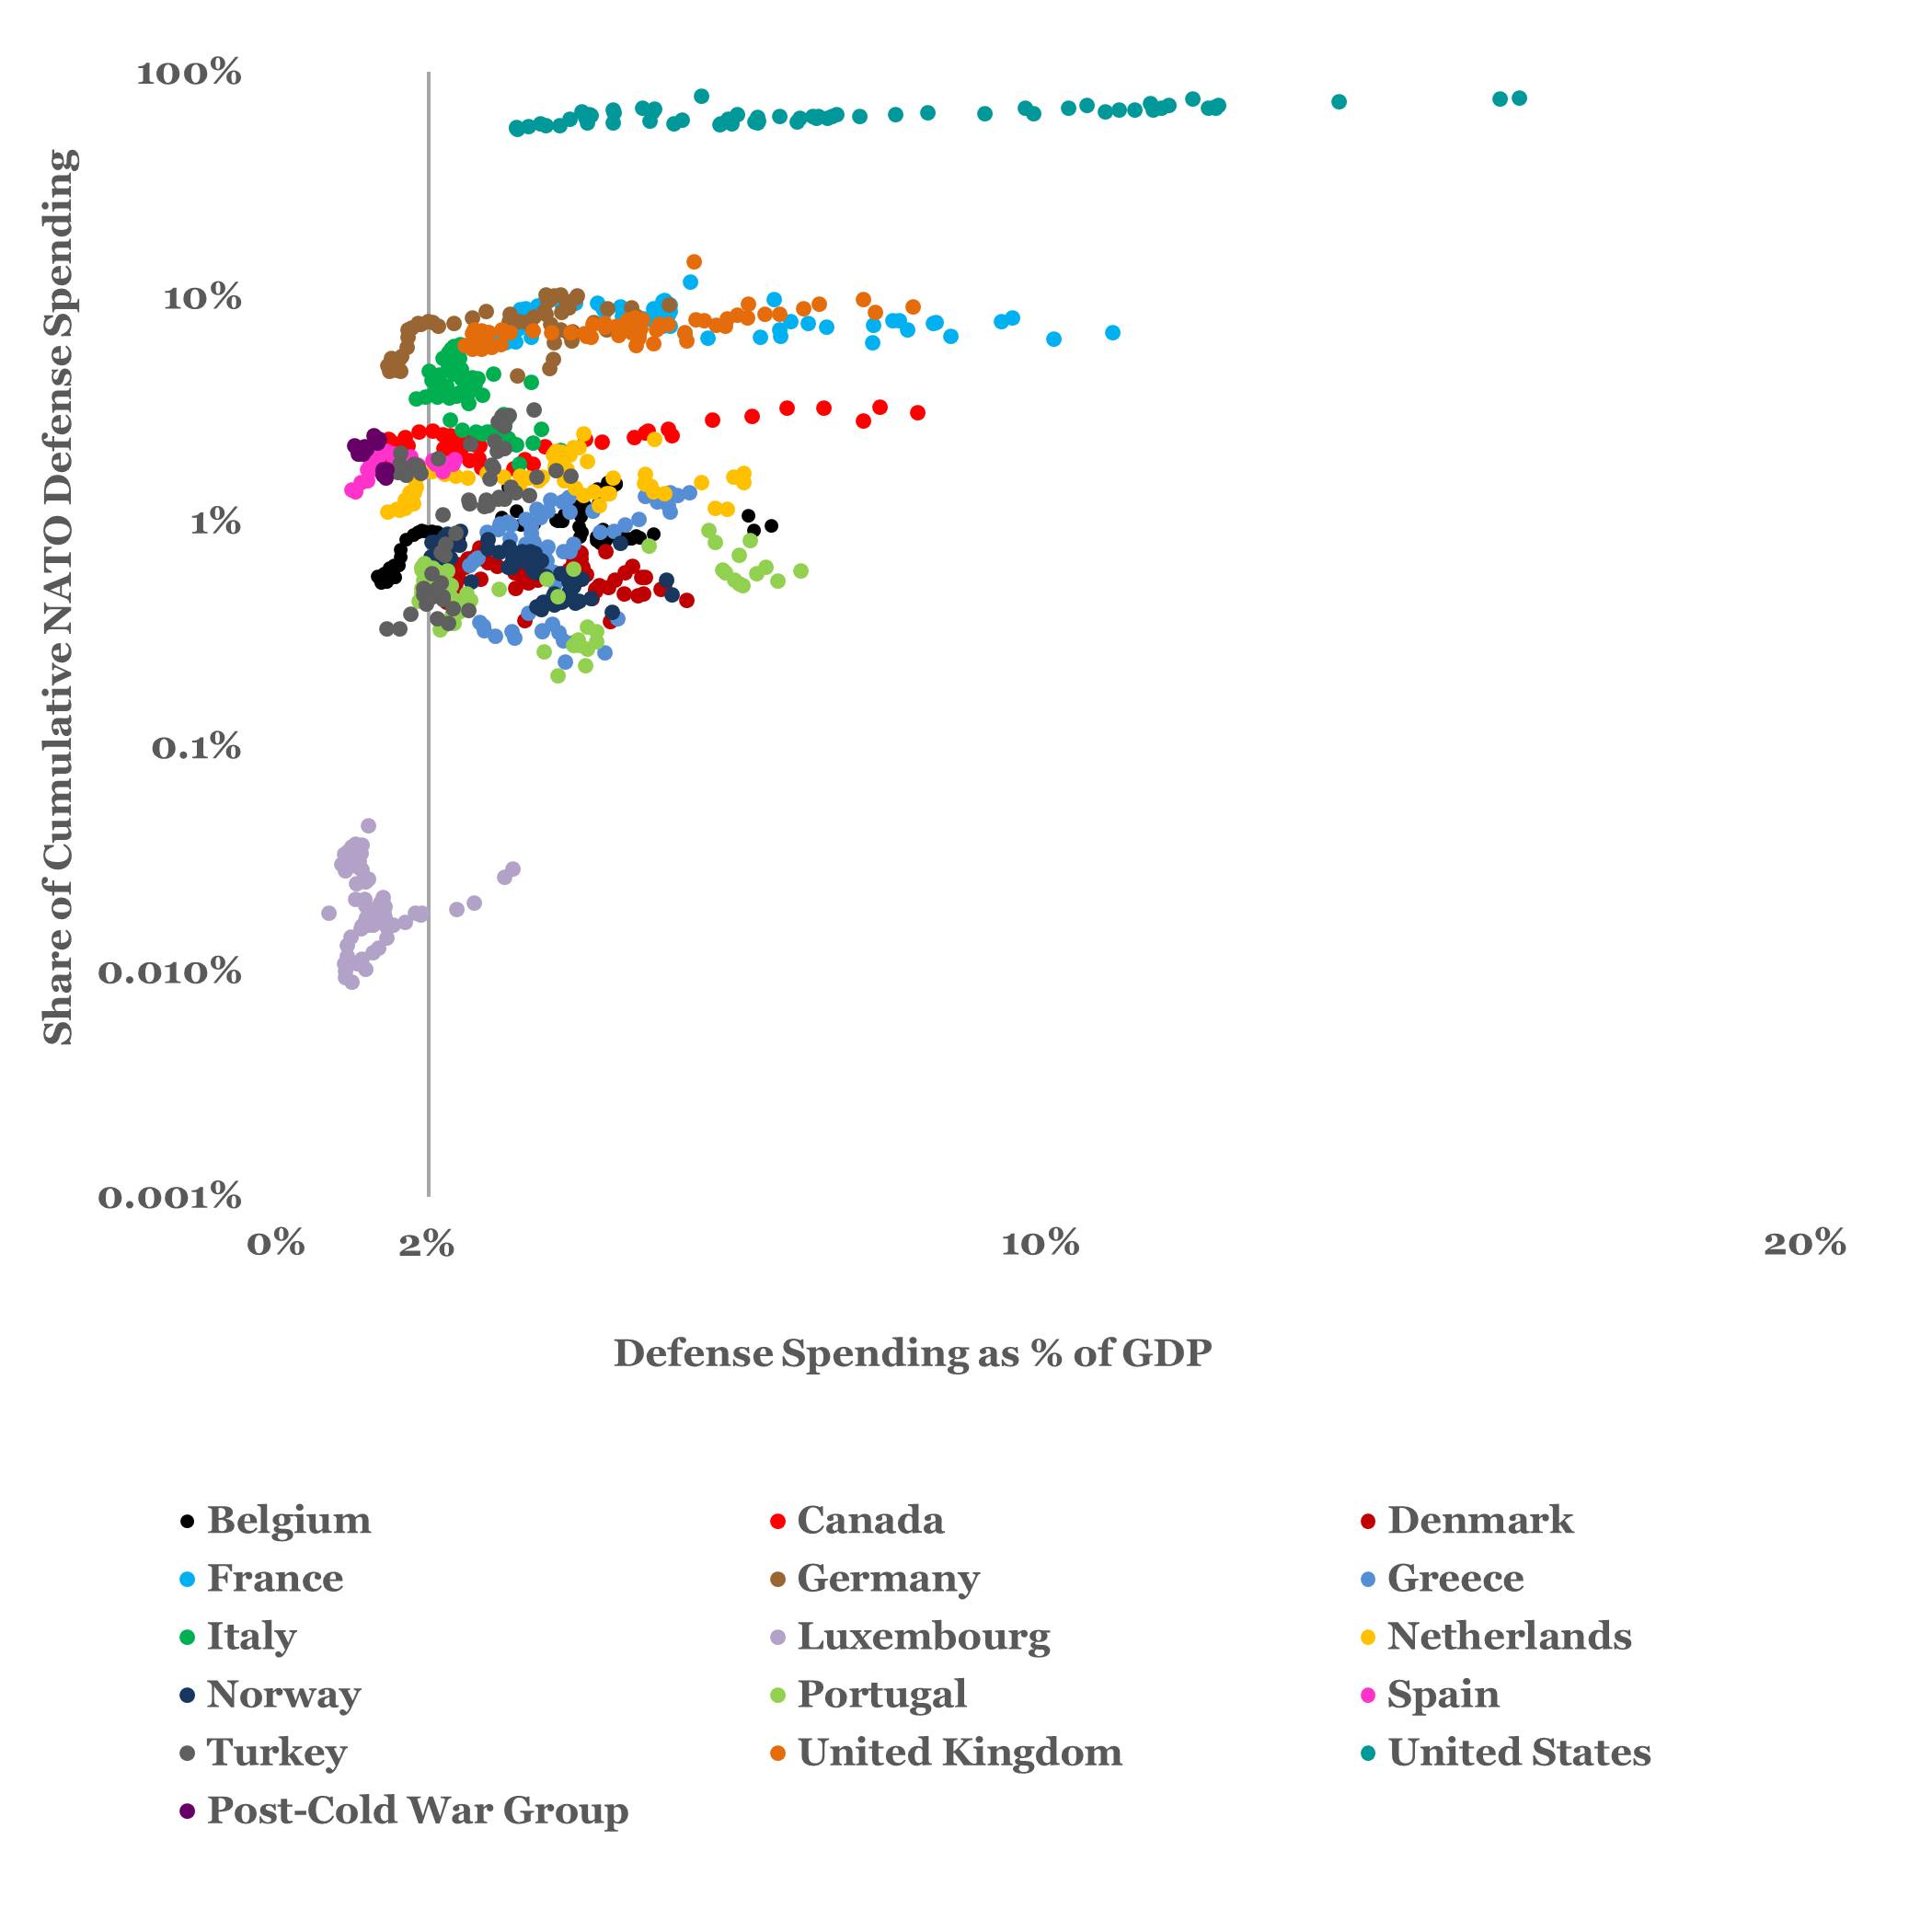
The third graph compares % of GDP to the share or percentage each member nation has contributed to annual cumulative defense spending. The U.S. (aqua) and Luxembourg (lavender) are the obvious outliers in terms of magnitude. Generally, the NATO members show fairly consistent behavior, contributing approximately the same relative proportion over time. Only the contributions of Greece (blue-grey), and Italy (Kelly green), Luxembourg (lavender), and Turkey (dark grey) have varied by more than 300% over the duration of their participation in the alliance.

nato_defspnd_part1_img1-3_mbrshareofnato_v_pergdpMember defense spending as % of GDP v. member per share or percentage contribution to cumulative annual NATO defense spending

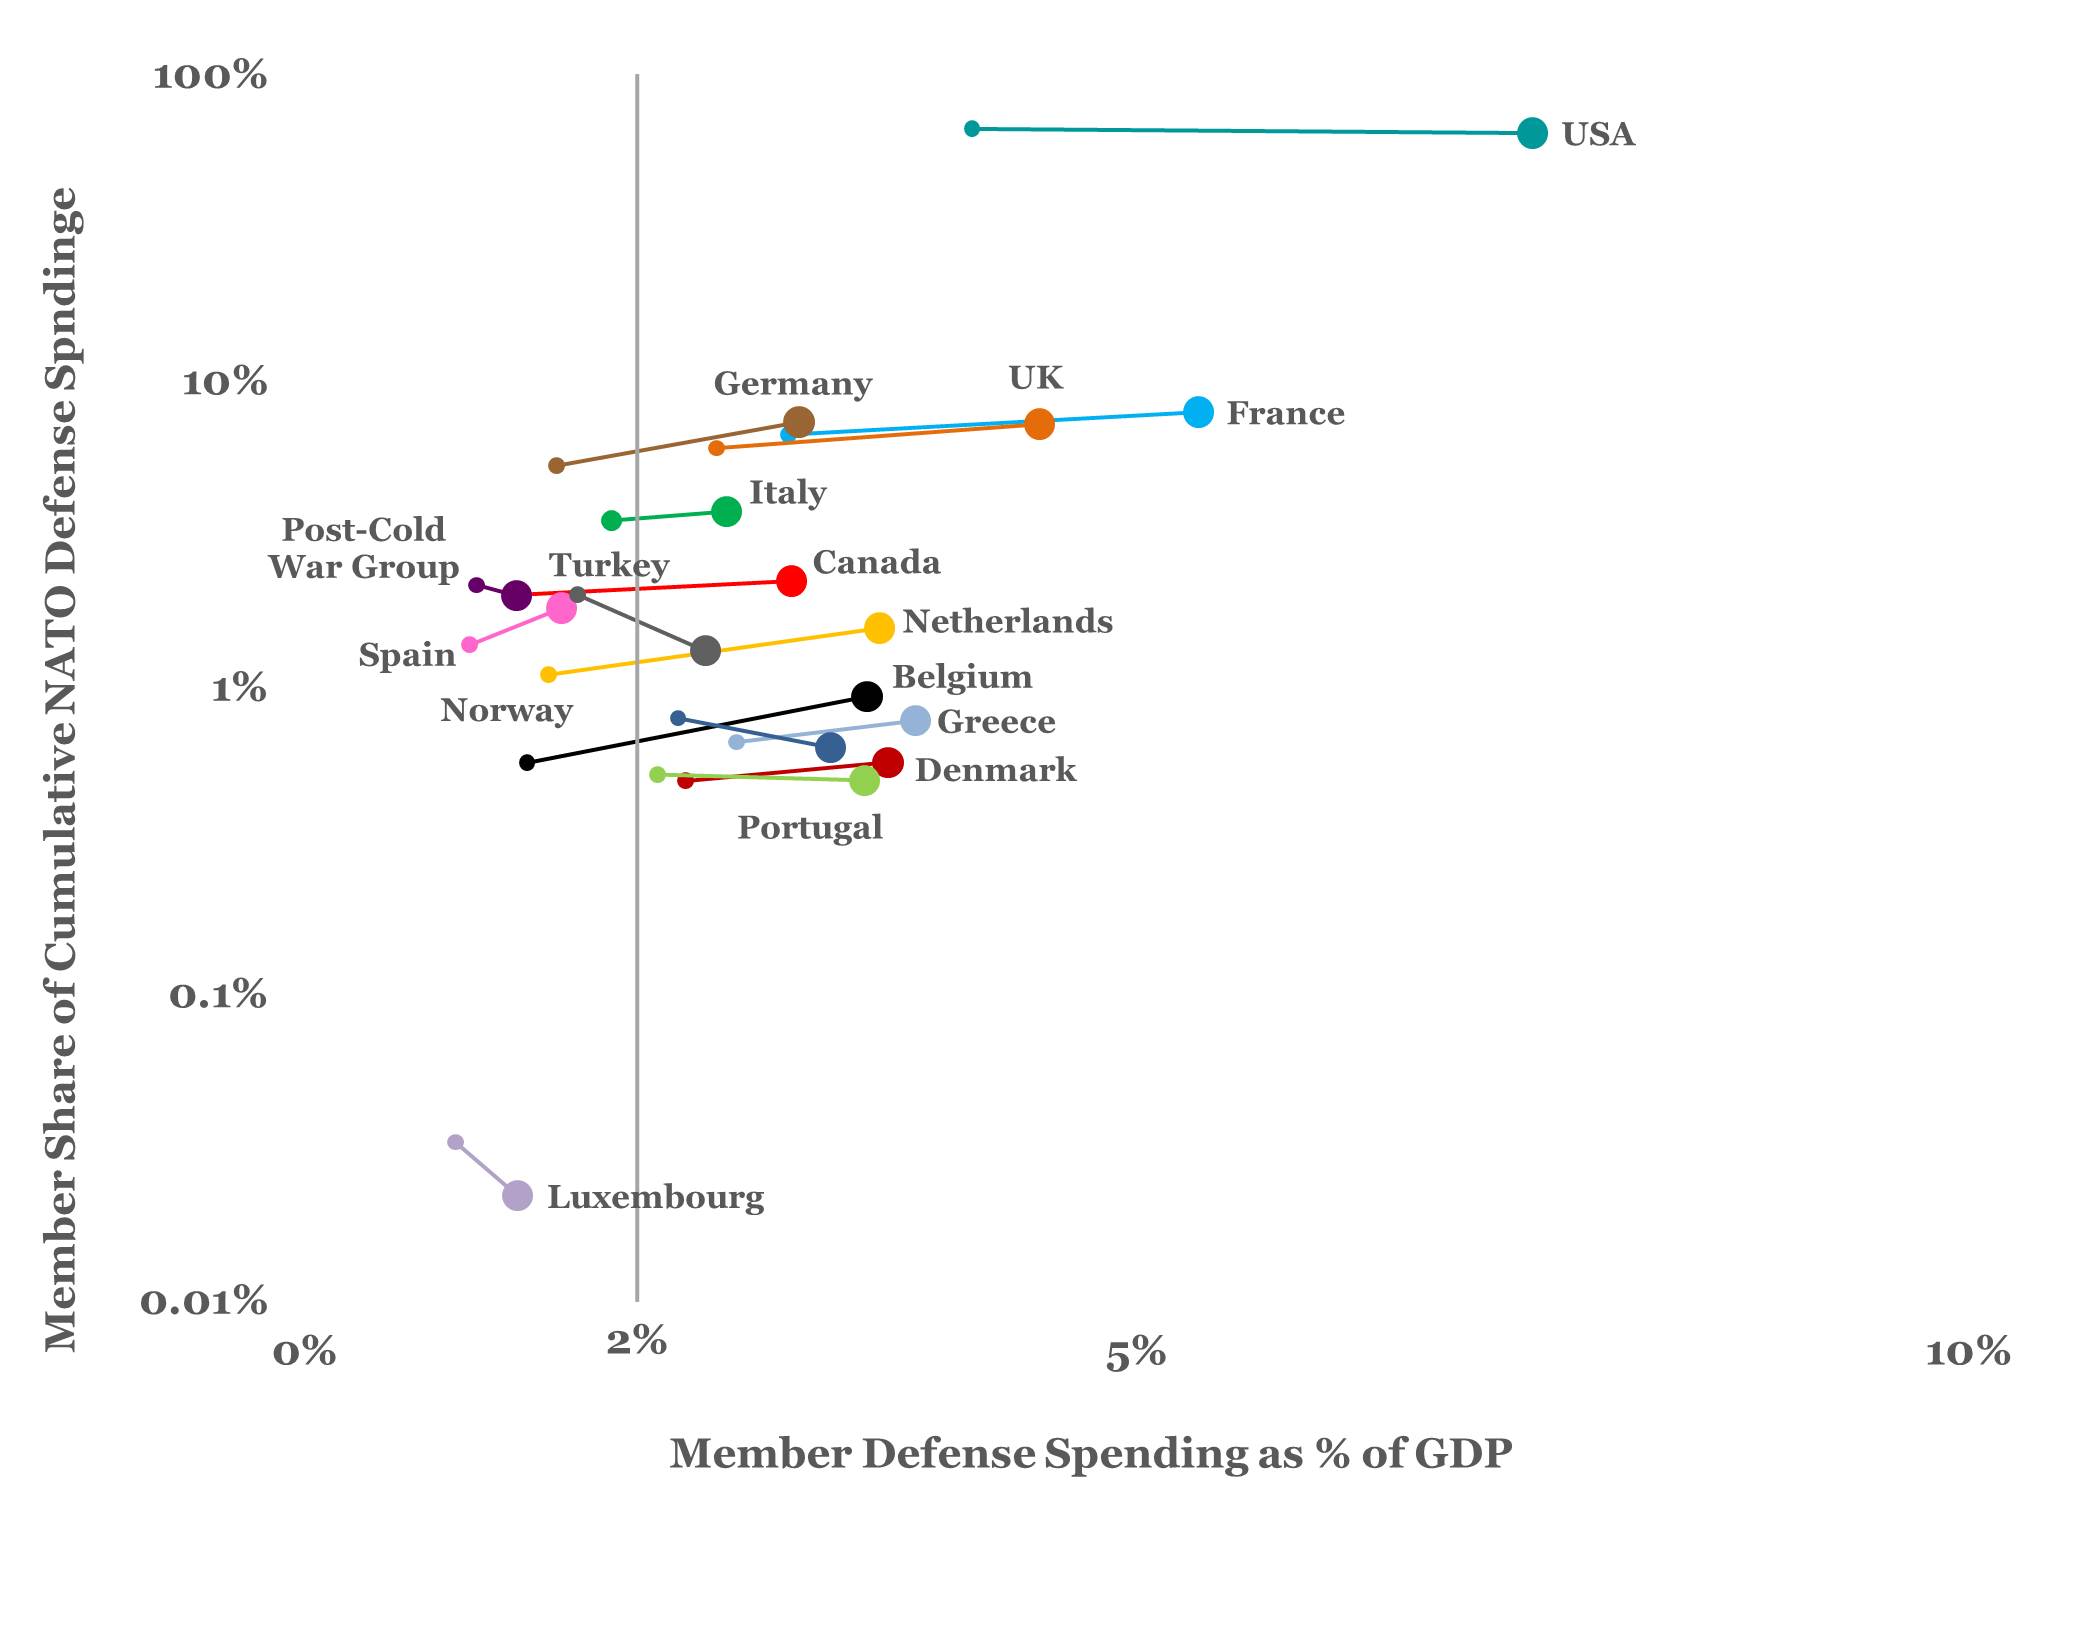
The format of the fourth graph sets up the more detailed focus on individual member nation spending patterns which will follow in the next two essays. The fourth graph repeats the same data from the third graph but in a simplified format. In place of the dot scatterplot, the centroid or average of each member nations’ data is represented by a single large dot. The data for 2013 is shown as a smaller dot and the 2013 dot is anchored to the average dot to maintain the relationship. The line connecting the two could be interpreted as a curve but keep in mind the log scale of the vertical axis. The dot-connecting lines are primarily a graphical device.

We see in the fourth graph that, in all cases, 2013 defense spending as a % of GDP is significantly lower than the historical average. This is not to advocate for a return to the arbitrary metric of historical average, merely to account for the present in the context of the alliance’s past.

In 2013, the U.S. spent about 4% of its per capita GDP on defense, everyone else paid less than 3%, and some were in the neighborhood of from 1-2%. One may also note by the relative vertical position of the dot pairs that with the exceptions of Luxembourg (lavender), Norway (dark blue), Portugal (light green), Turkey (dark grey), the U.S. (aqua), and the collective post-Cold War group (plum), the other members’ 2013 contributions were also smaller proportions of the NATO whole than their historical averages (smaller dot lower than large dot).

nato_defspnd_part1_img1-4_mbrshareofnato_v_pergdp_simpMember defense spending as % of GDP v. member per share or percentage contribution to cumulative annual NATO defense spending. This is the same information as the third graph simplified.

In sum, any particular member nations’ defense spending in a particular year in terms of historical averages is not necessarily meaningful in the context of the value of the NATO alliance to either the particular member or to the whole. But the history can be useful for framing questions on apportionment, return on investment (in a very broad sense, of course), and the reasonableness (or not) of command spending “requirements” based on gross macroeconomic parameters.

In the next essay, we’ll move from the 30,000′ view and take a more detailed look at the individual members military spending history.


Dave Foster is a civilian analyst for the U.S. Navy. He is a former Marine Corps officer and holds degrees in engineering, history, and management. The views expressed here do not represent those of the Department of Defense or the Department of the Navy.

Leading Where? Reflection on “Saltwater Leadership”

By Erik Sand

In his book Saltwater Leadership, Rear Admiral Robert O. Wray admits that he is not trying to add to the body of leadership knowledge. He seeks to provide a condensed, tailored, leadership primer for junior sea service officers. He includes tidbits from 35 books and stories and advice from hundreds of seagoing leaders. Wray limits his explicit advice but implicitly portrays his vision of successful leadership through the excerpts and anecdotes he includes. While the leaders he envisions would succeed as junior officers, I am left wondering if they would have the skills needed to guide an organization in to the future.

Wray begins by asking, “What is leadership?” He determines that “leadership is the process of getting people to do things.”[1] This simple idea encapsulates the daily tasks of a junior officer. Whether on watch or working with a division, new junior officers must ensure the completion of tasks for which they lack the training to complete themselves. They can complete few of their responsibilities without the work of others.

Yet, Wray quickly muddies the water in answering his next question: “What is the difference between leadership and management?” He provides his own answer along with answers from various scholars and practitioners. In several cases, Wray’s definition of leadership sounds more like what these experts consider management. Wray writes, “Some say that leadership is deciding what to do, and why, while management focuses on how.”[2] The “how” of management seems more like the “process” of his leadership definition than what or why. Similarly, he quotes a leadership expert who states, “A leader knows what’s best to do; a manager knows how best to do it.”[3]

Wray’s original definition of leadership is not wrong. Indeed, it reflects exactly the qualities that earn promotion in today’s Navy. Rather, the contradiction between Wray’s original definition of leadership and his discussion of leadership and management demonstrates that eventually leaders must do more than get things done. Leaders must choose the right things to do.

Wray would likely agree. Leadership is prone to lists, he explains, because many traits and skills are required for success. The exclusion of certain traits from his core definition should not mean those traits are unimportant. The omission of “what and why,” however, continues through the book. Wray surveyed 380 naval leaders from senior enlisted to admirals asking what traits were most important for junior officer success. Integrity, character, and trustworthiness topped the list. Summarizing the overall result, he describes successful junior officers as “ honest, hardworking teammates.”[4] No one should downplay these virtues. They are essential for successful leadership, but they tend toward “how.” The respondents deemed traits needed to make determinations about “what and why” less important. Analytical thinking came in at 18 of 76, and inspiration, vision, scholarship, insight, inquisitiveness, and conviction fell in the bottom third.

The book may emphasize “how” over “what and why” because it targets junior officers. Junior officers spend more effort on the process of doing than on deciding what to do and why to do it. If, however, the skills needed for successful leadership change as a career progresses, the book does not mention it. At some points, it suggests the opposite. Wray writes that “leadership lessons and concepts can be universal.” [5] When he provides caveats, he compares the boardroom and the battlefield not the deckplates and the Captain’s chair. Moreover, several of the stories he includes, such an aircraft carrier captain facing an unconfirmed report of a man-overboard, describe situations a junior officer would almost never face. These stories teach valuable lessons about leadership and life at sea, but their inclusion reinforces the sense that the while the book is tailored for junior officers its view of leadership is not.


The Navy has used checklists and written procedures for decades. Today, however, units receive more direction from headquarters than ever before. Type commanders not only direct what training evolutions ships must complete and when, but they also provide detailed grading rubrics specifying exactly how those evolutions must be accomplished. Time dedicated to growing administrative requirements distracts officers from core competencies. Just as Saltwater Leadership seems to focus on the undoubtedly important “how” at the expense of the equally important “what and why,” so too does our Navy.

Admiral Wray has produced a useful compilation of leadership advice for junior officers learning how to lead and how to get things done, but unless those new leaders also learn to make decisions about what must done and why, our future Navy will find itself underway but adrift.

Erik Sand is an active duty U.S. Navy Surface Warfare Officer stationed at the Pentagon. His views do not reflect those of the Department of Defense or the U.S. Navy. He is indebted to the contributions of Midshipman Amanda Assenmarcher for providing a perspective from this book’s intended audience.


[1] Wray, Robert O., Saltwater Leadership: A Primer on Leadership for the Junior Sea-Service Officer (Annapolis, MD: Naval Institute Press, 2013), 5.

[2] Wray, Saltwater Leadership, 6.

[3] Wray, Saltwater Leadership, 6.

[4] Wray, Saltwater Leadership, 85.

[5] Wray, Saltwater Leadership, 11.

Sea Control 56 – Forgotten Naval Strategists

seacontrol2Tiago Alexandre Fernandes Maurício, associate editor for our Forgotten Naval Strategists Week, joins us from Tokyo to discuss Fernando Oliveira and our other Forgotten Naval strategists – as well as how these strategists become “forgotten.” There’s a bit of Peloponnesian War thrown in too… just because.

DOWNLOAD: Sea Control 56 – Forgotten Naval Strategists

Considering leaving a comment and five-star rating on Itunes, Stitcher Stream Radio, etc… Remember to subscribe and recommend us to your friends!

Note: Thanks to Sam LaGrone for the kickin’ new tunes.