Discussions and data presentations surrounding the recent NATO summit on member state spending levels on defense and the now-metronomic domestic squabbles over the United States’ own military budget have centered on the percentage of gross domestic product (% of GDP) benchmark. GDP is a hoary and problematic macroeconomic metric in its own right. Further, % of GDP offers no natural rationale for defense or any other budgetary programming, per se. Indeed, because of its fuzziness, GDP is thus dually ambiguous in its role as a primary measure of economic viability and as a stake in the ground for national planning. Is NATO’s goal to get military spending up to 2% of GDP in the coming decade plausible? This question inspired a look at the alliance’s GDP and defense budget history.
The following essay is the first in a three-part series which together provide a macroeconomic overview of the 55 year old defense alliance. This first essay presents the history of NATO member nation defense spending since the alliance was founded in 1949. Eleven of the twelve founding members (Iceland is excluded from the analysis in this series for a lack of defense expenditure data) and four Cold War additions (Germany, Greece, Spain, and Turkey) are plotted individually because their longevity provides substantial history for member and alliance defense spending context. The twelve post-Cold War enlargement members are grouped into a single category in this first essay but are considered individually in the second and third papers.
The second paper will look a little closer at the defense spending history and trends of individual member nations and selected sub-groups. The third will examine the concept of command spending models such as setting a goal for each member to spend “2% of GDP” via a look at several other hypothetical spending models.
The source for NATO member nation defense spending for 1949-2013 is the SIPRI Military Expenditure Database. The SIPRI dataset also has a table containing most—but not all—of the expenditure data computed as a percentage of GDP. In order to fill in some of the missing information, for example for Turkey for the 1953-1959 period, an analytical dataset for member nation population and GDP was created from the Penn World, International Monetary Fund World Economic Outlook (IMF WEO), and Maddison Project datasets, using Bureau of Labor Statistics Consumer Price Index and World Bank Purchasing Power Parity conversion factor for currency conversion to a constant dollar baseline reference. All currency data in this series have been converted into 2014 U.S. dollars (US$2014).
As mentioned at the outset, “GDP” is ambiguous because it can be computed many ways according to the assumptions underlying a given dataset. The Penn World, IMF WEO, and Maddison data sets demonstrate strong correspondence in most cases where their datasets overlap but in some cases they diverge significantly. The Penn World purchasing power parity (PPP) PWT8.0 dataset was supplemented and adjusted with the other datasets and currency conversion sources to provide data for as many years of each member nation’s participation in the alliance as possible. Information on the adjusted dataset assumptions and methodology is available at this link.
The four graphs shown below present NATO member % of GDP spent on defense in direct comparison to, respectively, GDP, per capita GDP, and member share of cumulative NATO defense spending in a scatterplot format. Both horizontal and vertical axis categories are independent and the time-series/chronology is implied in the data rather than explicitly annotated (typically as the independent axis). Thus the entire history of NATO defense spending—who spent how much historically—is available at one glance.
The first graph shows % of GDP verses GDP. Although specific years are not listed, we can infer approximate chronology from the knowledge that constant dollar GDP has generally grown since 1949. Thus, the more recent years are found higher up the vertical logarithmic axis. The basic pattern is a right hook: as a member’s GDP rose, % of GDP spent for defense typically decreased, though, in some cases, there are notable abrupt shifts, as can most noticeably be seen in the last dozen dots for the United Kingdom (dark orange) and the United States (aqua). These shifts to higher % of GDP spending on defense reflect these nations’ budgetary adjustments to the wars of the past decade.
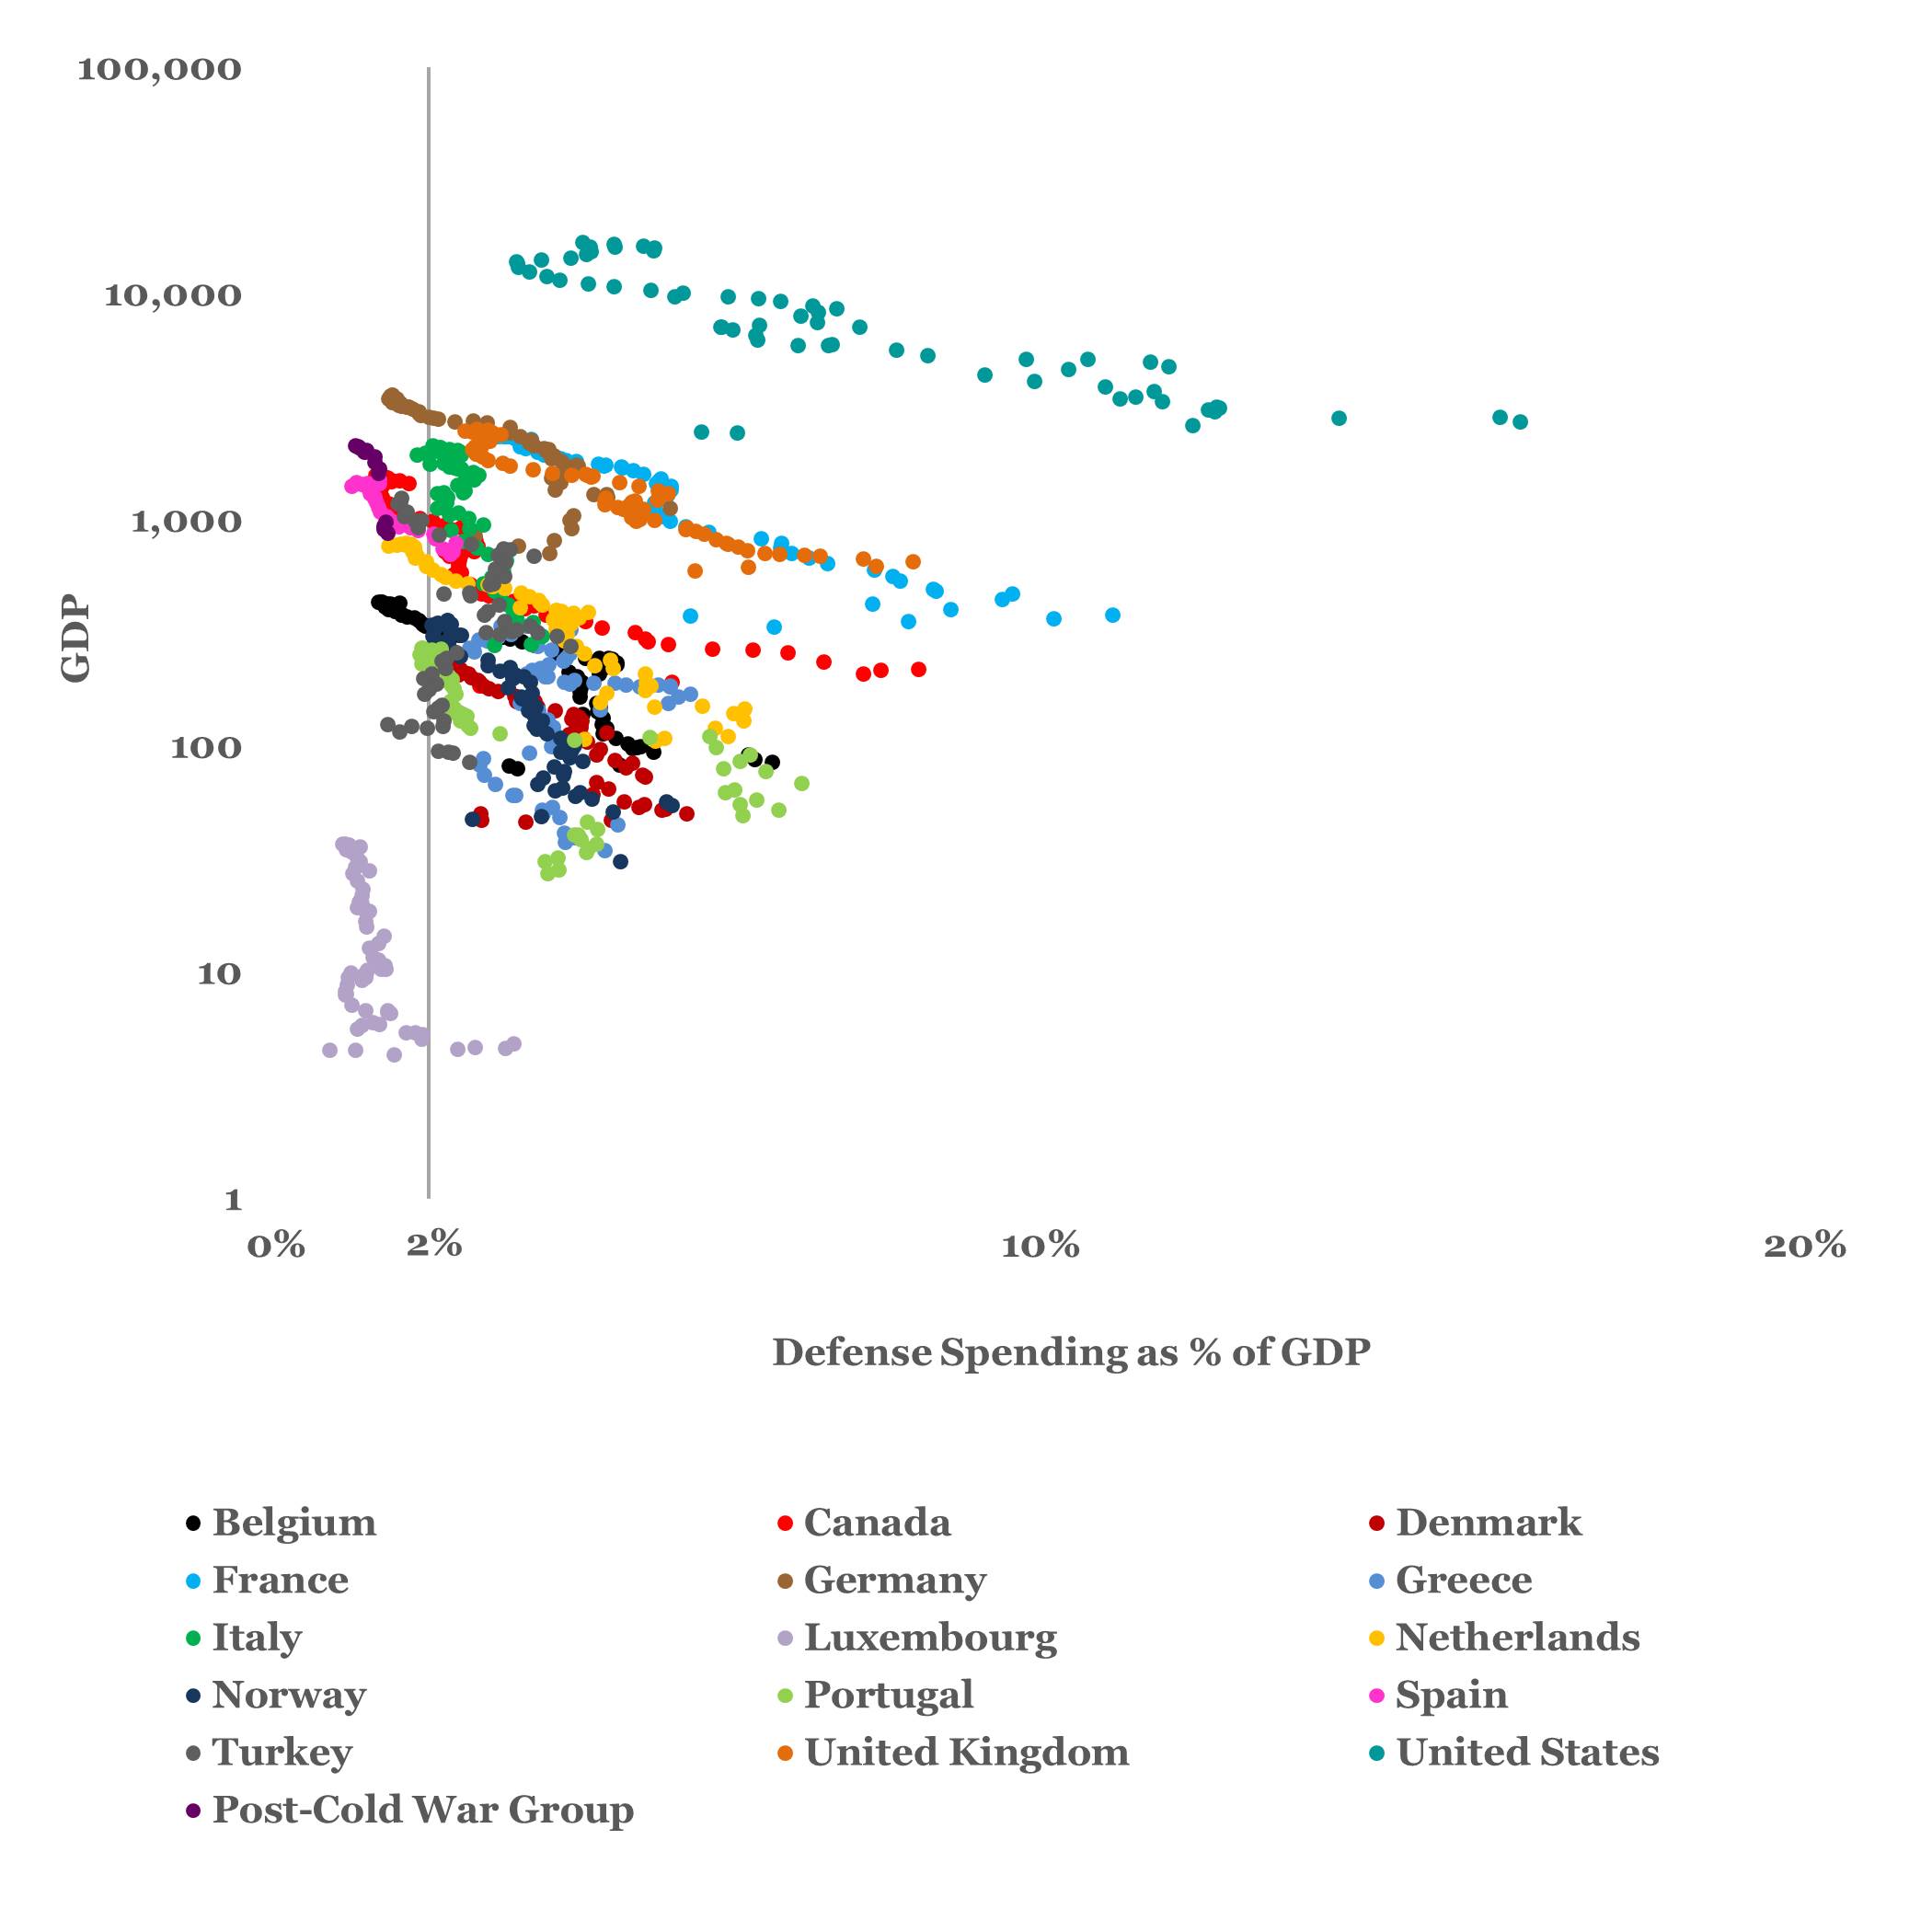 Member defense spending as % of GDP v. member GDP (billions)
The second graph plots % of GDP against per capita GDP. This chart in particular illuminates at least one problematic aspect of a %-of-GDP basis for defense spending when per capita national affluence, rather than aggregate national affluence, is emphasized. One may ask why if %-of-GDP is an admittedly arbitrary but plausible defense spending goal, wouldn’t a progressive per capita defense spending rate be more in line with most modern taxation models? Hypothetically, should those individuals who make more, and presumably benefit more from NATO security, perhaps pay more? This and several similar questions about hypothetical defense spending models are briefly examined in the third essay.
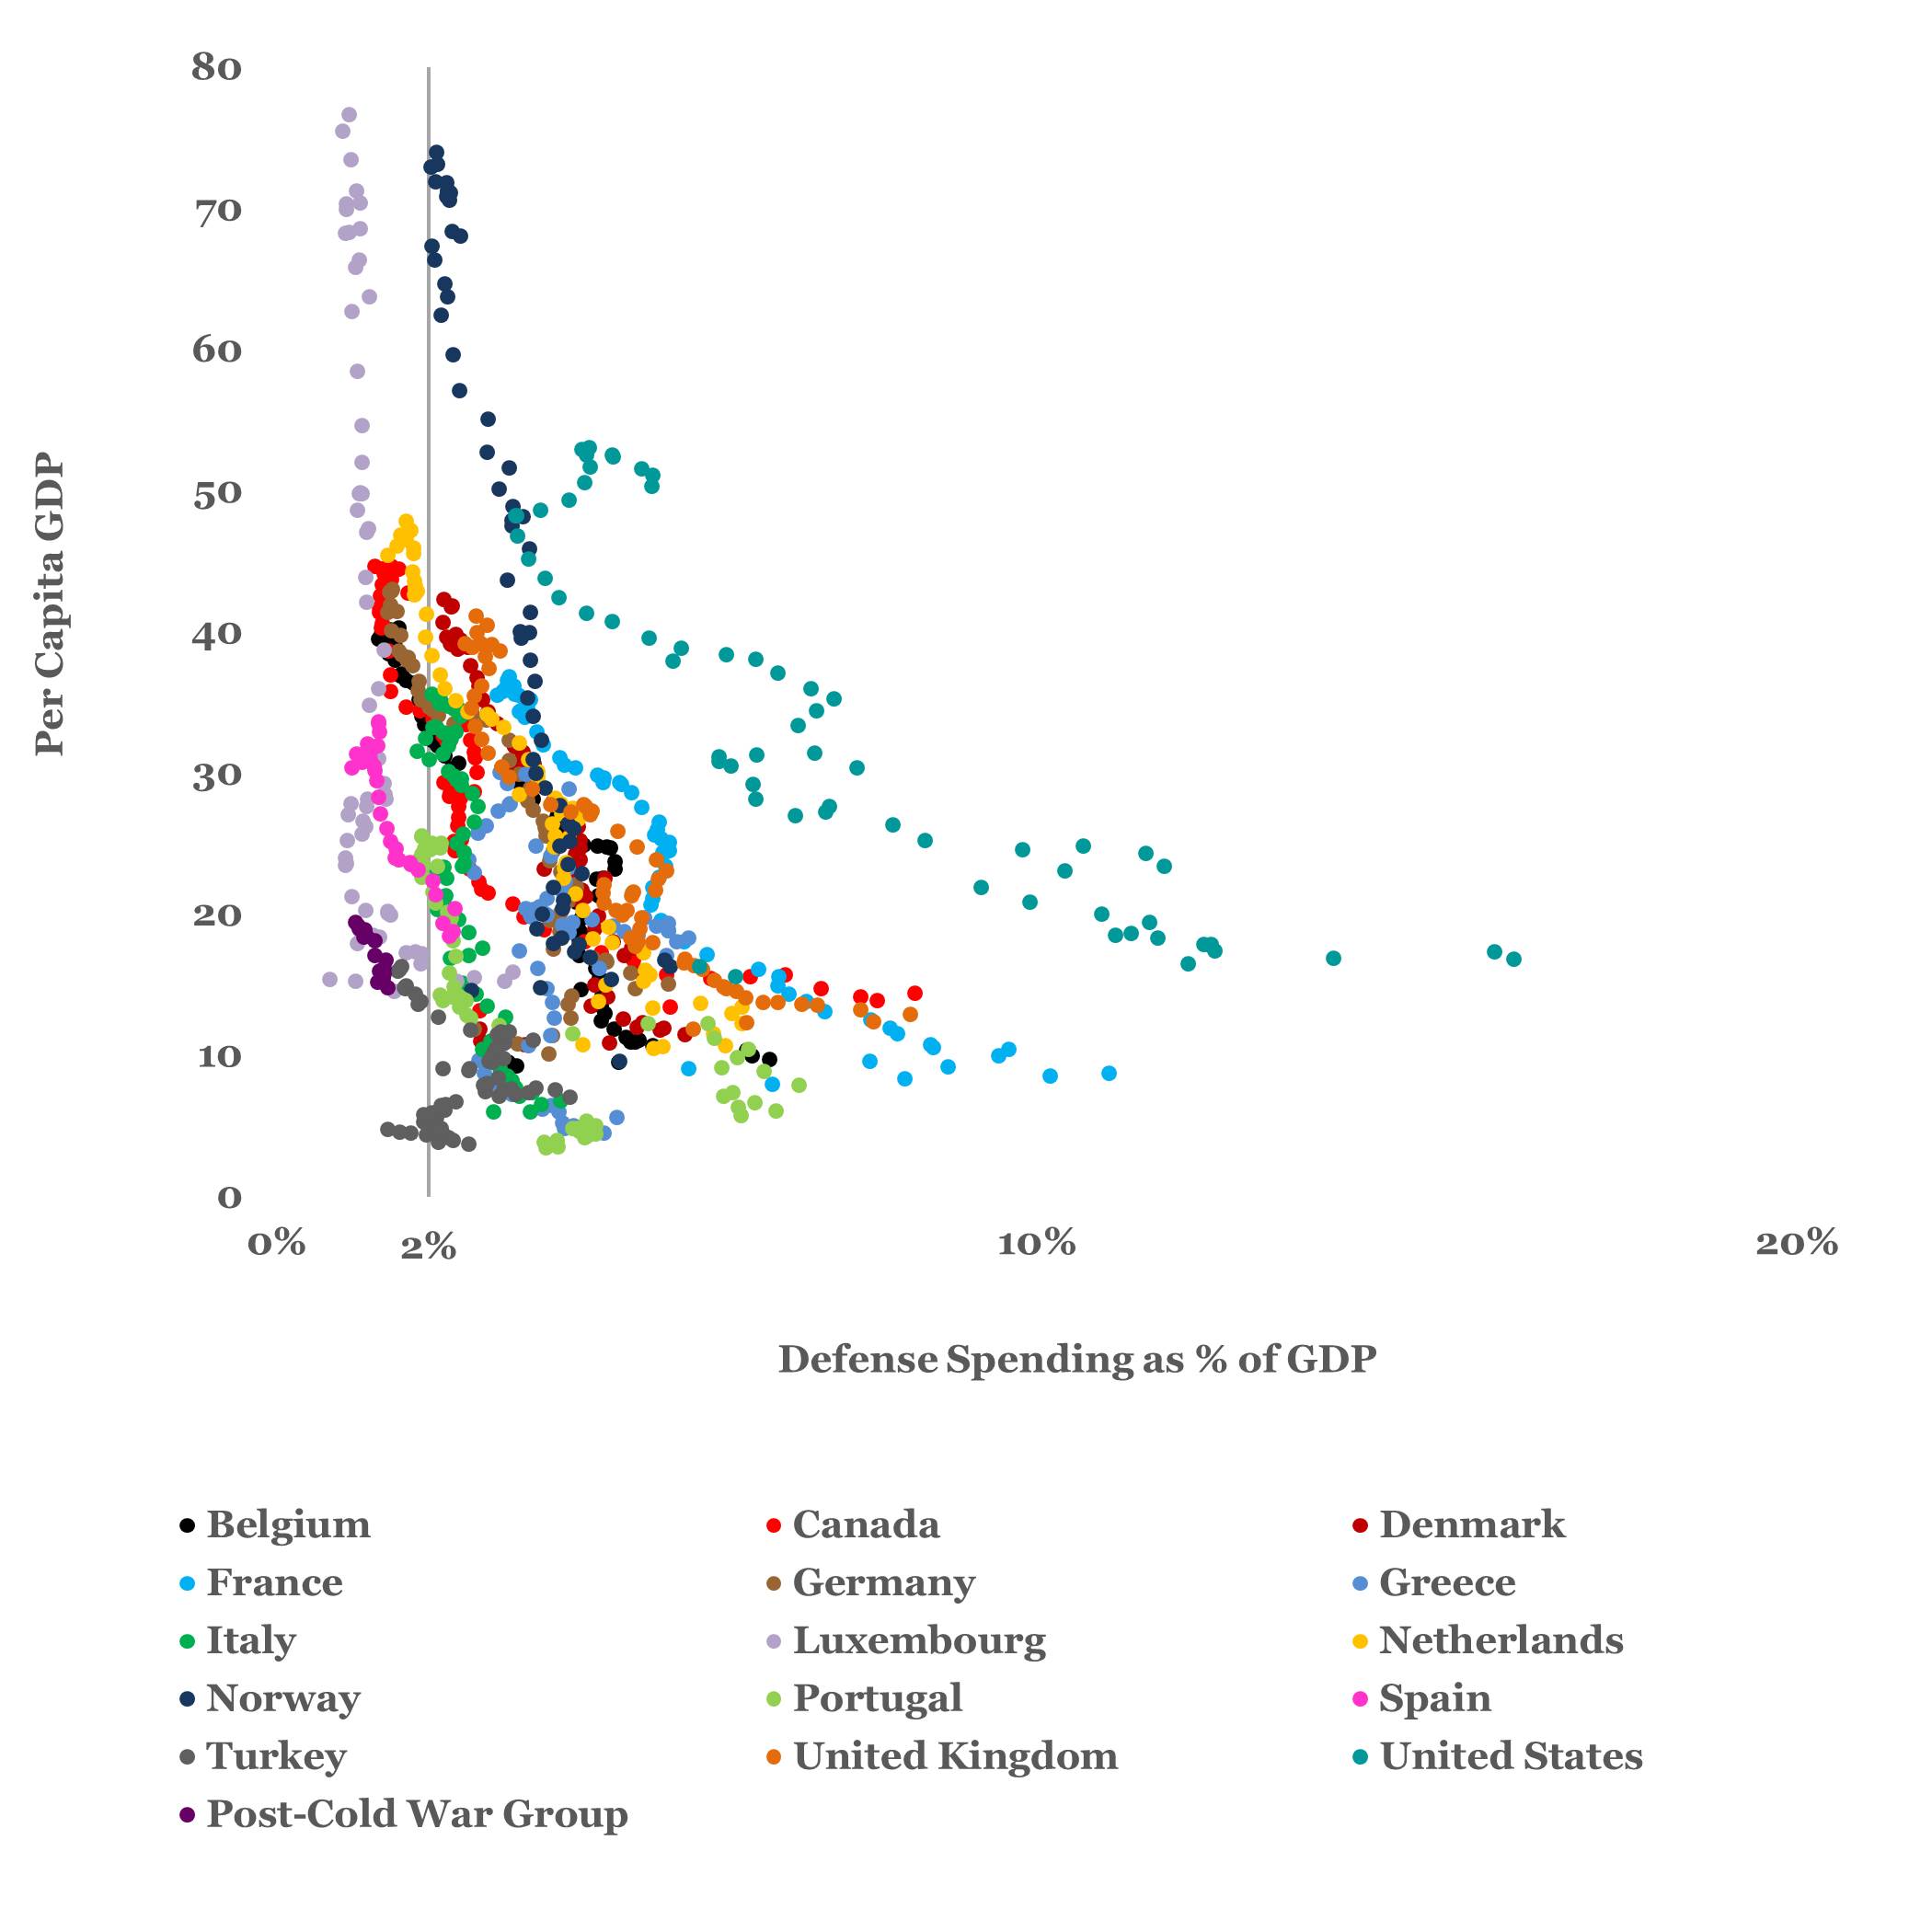 Member defense spending as % of GDP v. member per capita GDP (thousands)
The second graph shows that defense spending has congregated in the low single digits of % of GDP as per capita GDP has risen. However, several long-serving members have remarkably vertical %-of-GDP defense spending trends: Italy (Kelly green), Luxembourg (lavender), Spain (pink), and Turkey (dark grey) have remained within a relatively tight bracket of from 1-4% of GDP for defense spending throughout their history in the alliance.
The third graph compares % of GDP to the share or percentage each member nation has contributed to annual cumulative defense spending. The U.S. (aqua) and Luxembourg (lavender) are the obvious outliers in terms of magnitude. Generally, the NATO members show fairly consistent behavior, contributing approximately the same relative proportion over time. Only the contributions of Greece (blue-grey), and Italy (Kelly green), Luxembourg (lavender), and Turkey (dark grey) have varied by more than 300% over the duration of their participation in the alliance.
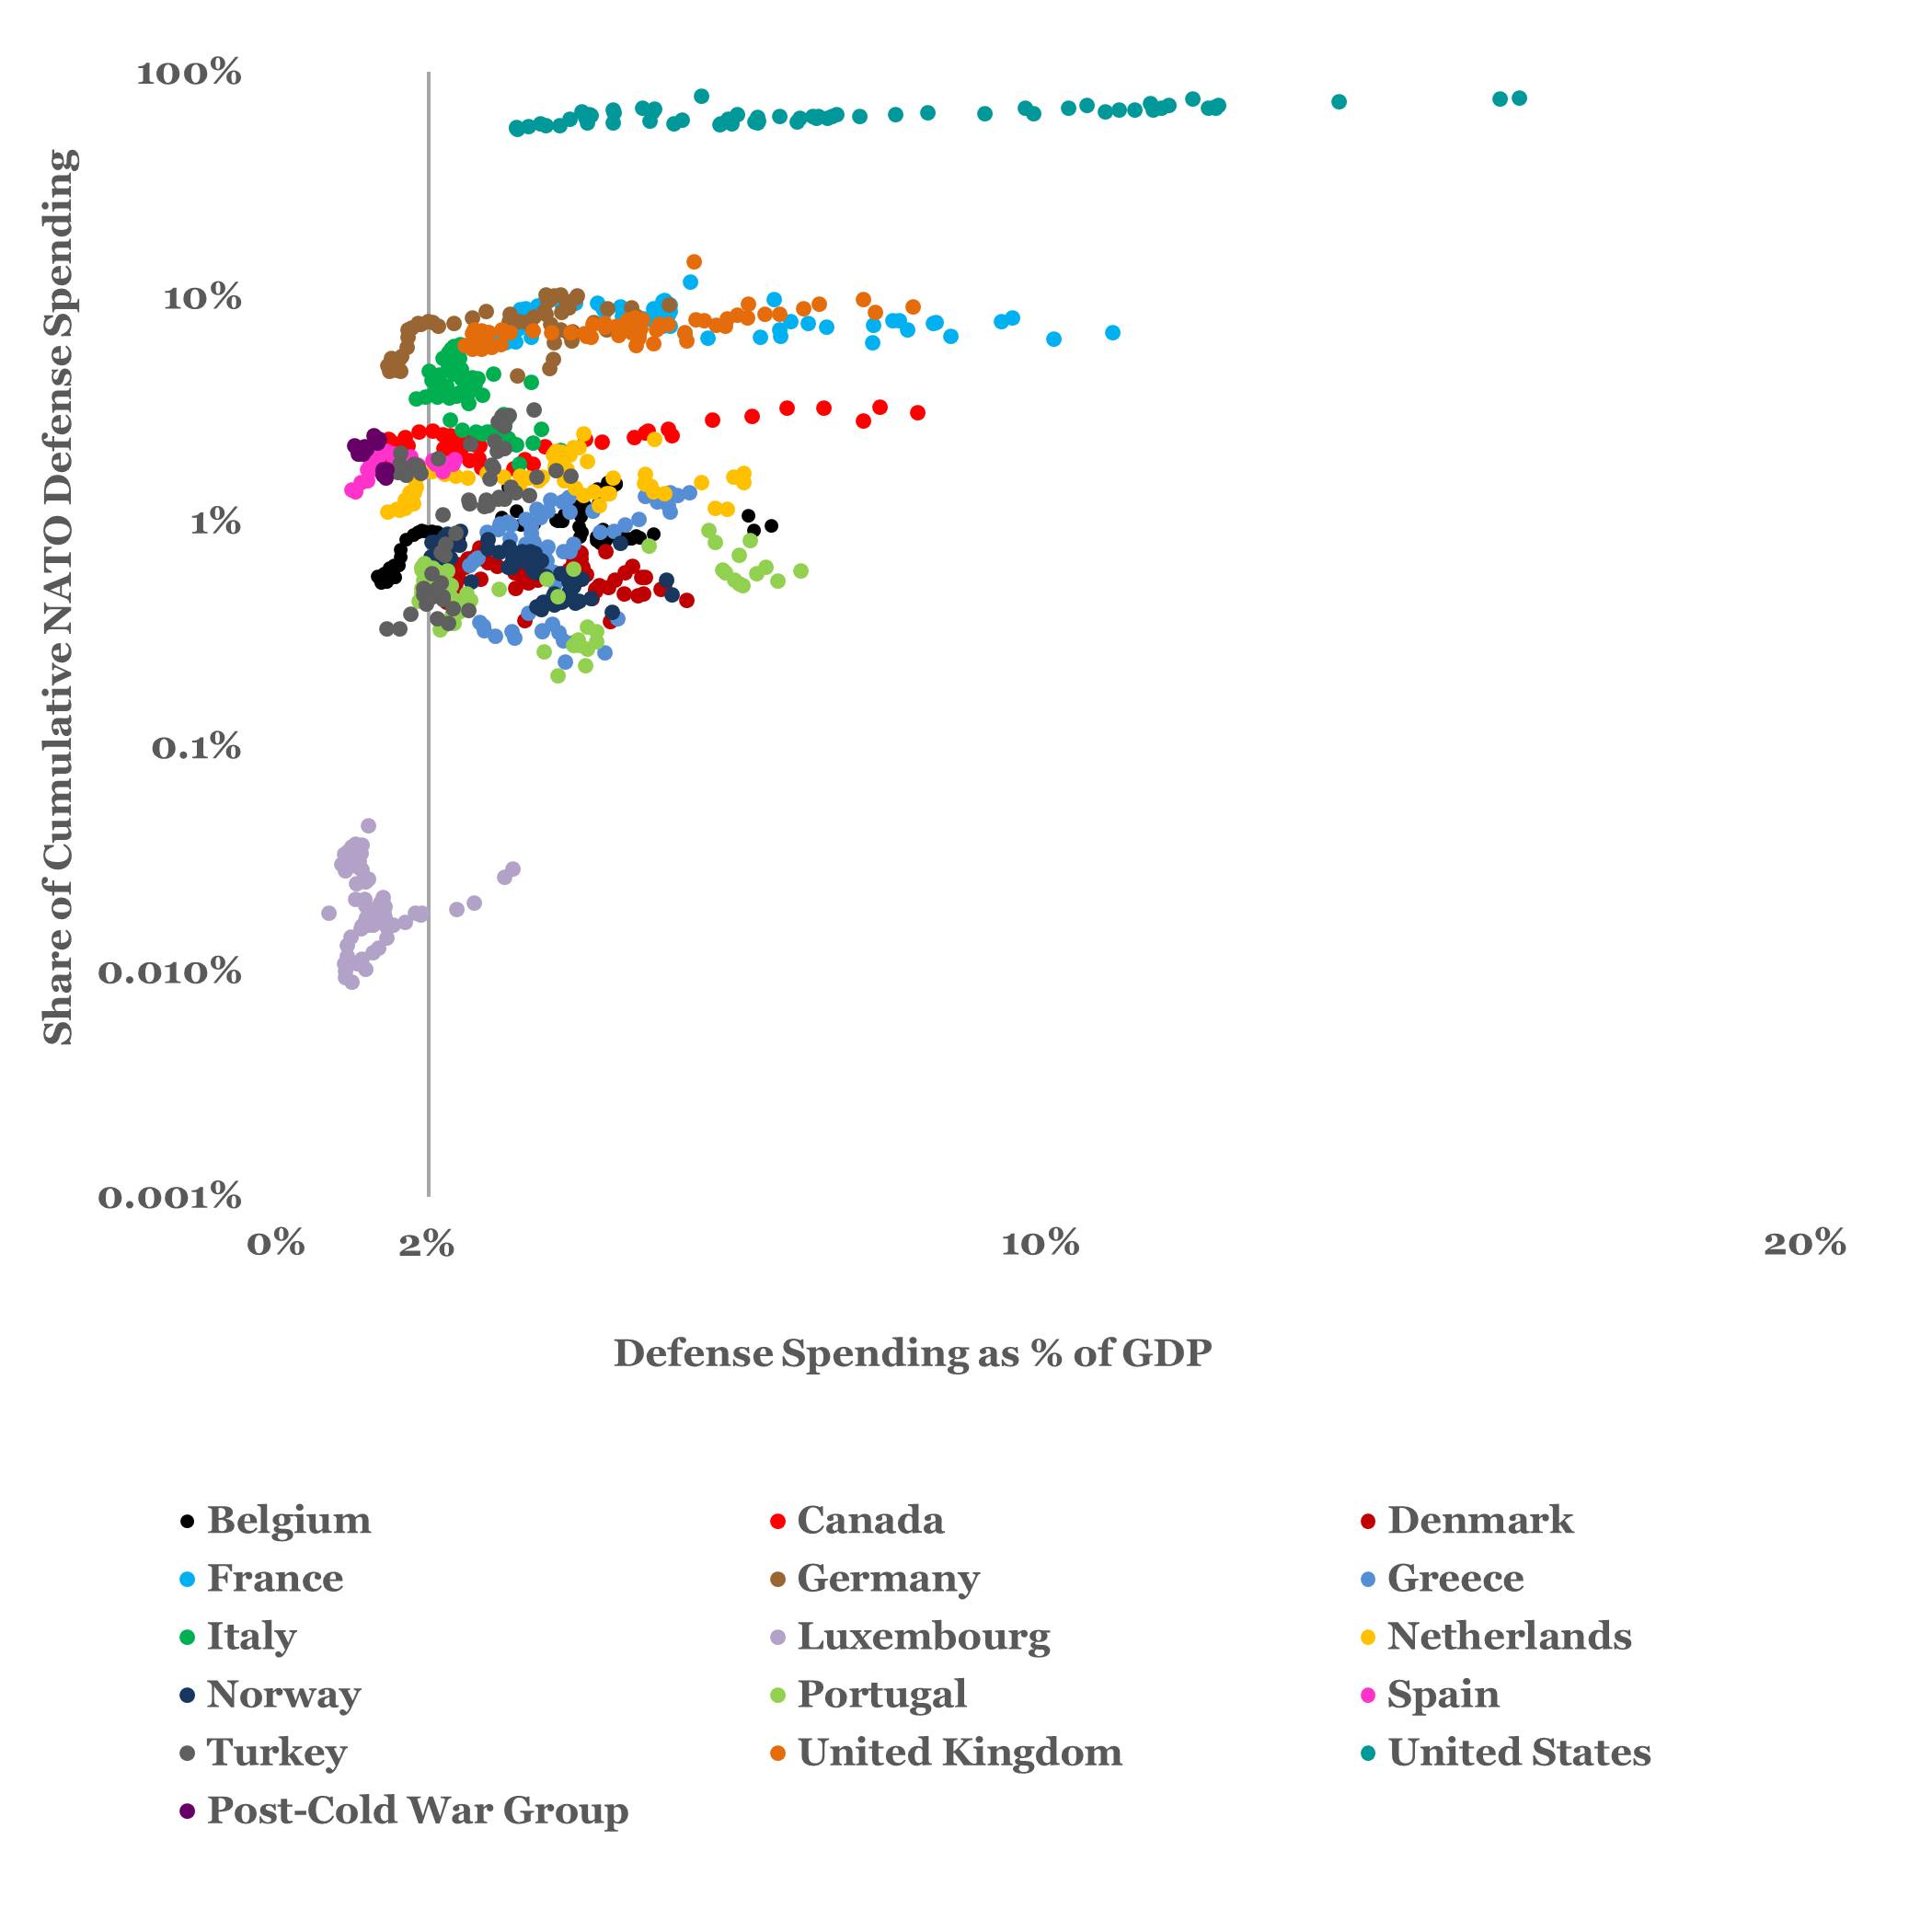 Member defense spending as % of GDP v. member per share or percentage contribution to cumulative annual NATO defense spending
The format of the fourth graph sets up the more detailed focus on individual member nation spending patterns which will follow in the next two essays. The fourth graph repeats the same data from the third graph but in a simplified format. In place of the dot scatterplot, the centroid or average of each member nations’ data is represented by a single large dot. The data for 2013 is shown as a smaller dot and the 2013 dot is anchored to the average dot to maintain the relationship. The line connecting the two could be interpreted as a curve but keep in mind the log scale of the vertical axis. The dot-connecting lines are primarily a graphical device.
We see in the fourth graph that, in all cases, 2013 defense spending as a % of GDP is significantly lower than the historical average. This is not to advocate for a return to the arbitrary metric of historical average, merely to account for the present in the context of the alliance’s past.
In 2013, the U.S. spent about 4% of its per capita GDP on defense, everyone else paid less than 3%, and some were in the neighborhood of from 1-2%. One may also note by the relative vertical position of the dot pairs that with the exceptions of Luxembourg (lavender), Norway (dark blue), Portugal (light green), Turkey (dark grey), the U.S. (aqua), and the collective post-Cold War group (plum), the other members’ 2013 contributions were also smaller proportions of the NATO whole than their historical averages (smaller dot lower than large dot).
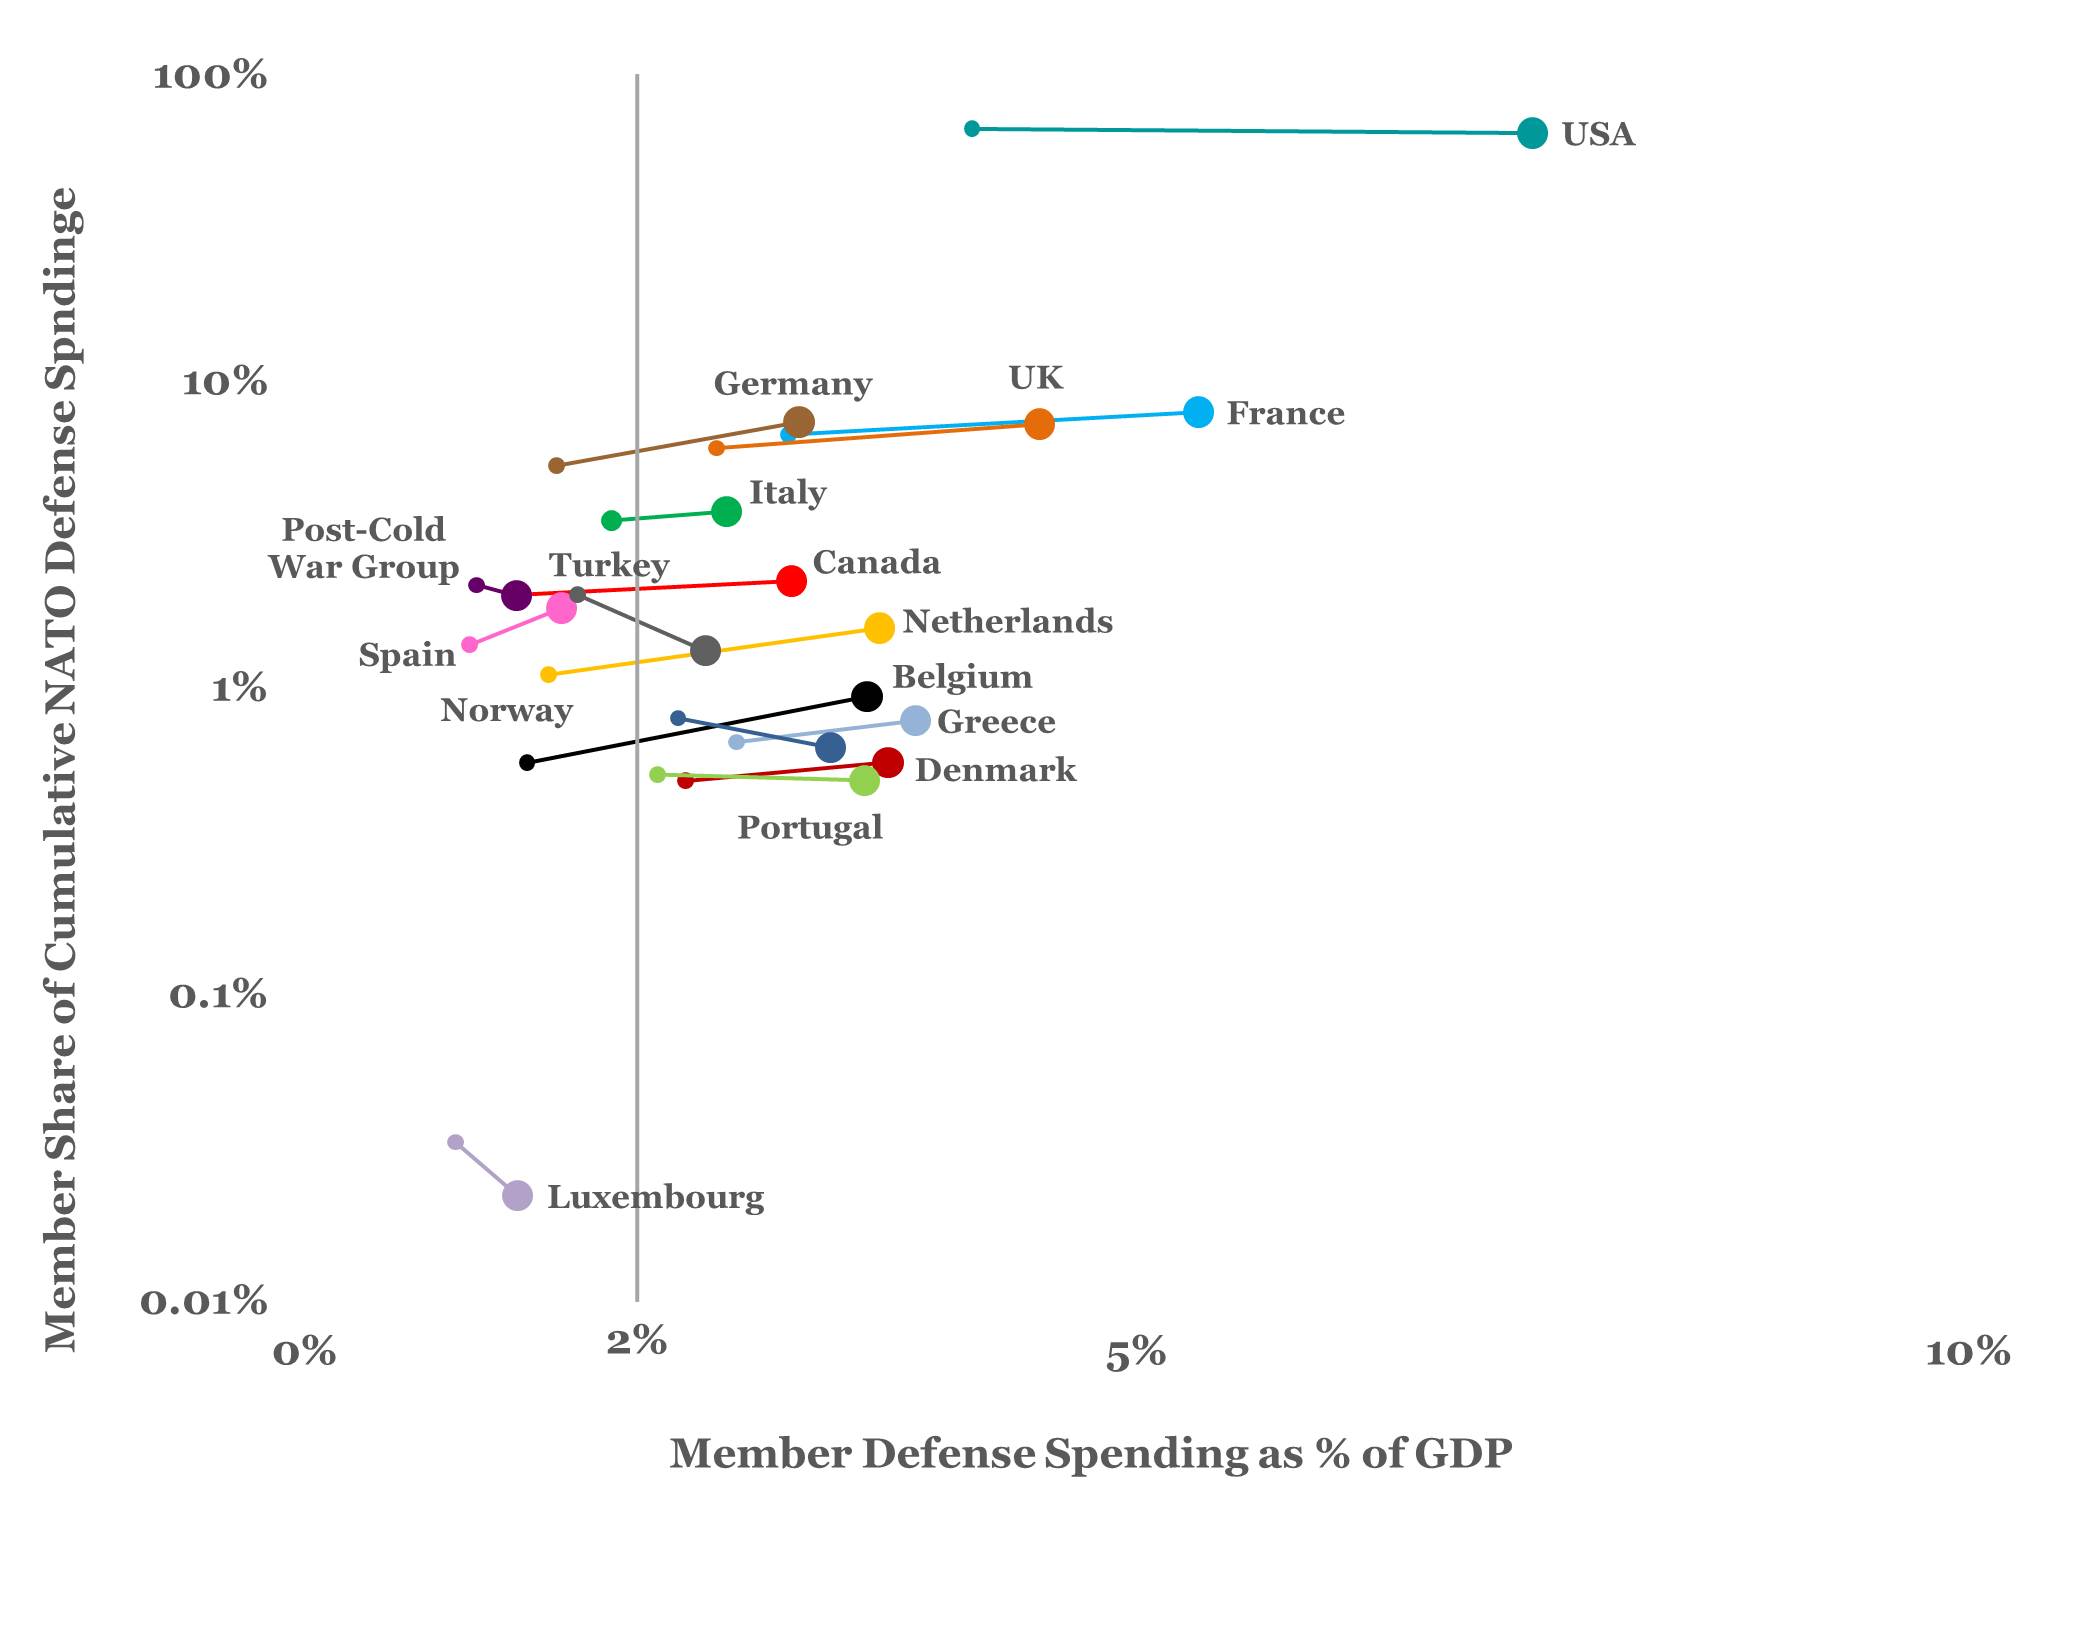 Member defense spending as % of GDP v. member per share or percentage contribution to cumulative annual NATO defense spending. This is the same information as the third graph simplified.
In sum, any particular member nations’ defense spending in a particular year in terms of historical averages is not necessarily meaningful in the context of the value of the NATO alliance to either the particular member or to the whole. But the history can be useful for framing questions on apportionment, return on investment (in a very broad sense, of course), and the reasonableness (or not) of command spending “requirements” based on gross macroeconomic parameters.
In the next essay, we’ll move from the 30,000′ view and take a more detailed look at the individual members military spending history.
Dave Foster is a civilian analyst for the U.S. Navy. He is a former Marine Corps officer and holds degrees in engineering, history, and management. The views expressed here do not represent those of the Department of Defense or the Department of the Navy.