“Facts are meaningless. You can use facts to prove anything that’s even remotely true. Facts, schmacts.”
-Homer Simpson, from Lisa the Skeptic
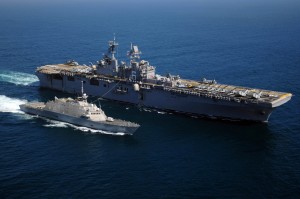
 Both Steven Wills in his USNI Blog opinion piece and Chuck Hill in his response trot out some interesting numbers in support of diametrically opposed positions on the survivability of LCS. According to Wills, the US Navy lost ships under 3400 tons at a much higher rate than larger vessels in WWII. Hill looks at the numbers and comes to the opposite conclusion. The debate reminds me of the recent statistical dustup over the Patriots’ propensity to fumble that has accompanied Deflategate. And the numbers are just about as meaningful.
Wills asserts that the US Navy lost 71 destroyers and 11 destroyer escorts in WWII. Hill makes that number to be 58 destroyers and 9 destroyer escorts. From what I can tell, they’re both wrong. Using the summary report for ship losses to enemy action from 17 October 1941-7 December 1944, the US Navy lost 134 destroyers and 16 destroyer escorts through December 1944. I could not easily find numbers from December 1944 through the war’s end, but the fact that these figures do not include losses from the Battle of Okinawa suggest that the actual number of destroyer losses for the whole war was closer to 150. Over the period of the report, the US Navy also lost 51 cruisers (CA and CL), 22 battleships, and 39 aircraft carriers (combining CV, CVL, and CVE losses).
After citing the number of losses, Hill uses the fate of vessels in commission at the start of the war to extrapolate survivability statistics for all vessels. Statistically, this is highly suspect. As Hill points out, the US fleet at the start of the war included just 233 major surface combatants. But between 1941 and 1945, the US built over 1,300 more major surface combatants, including 349 DD’s and 498 DE’s. Those ships in commission at the start of the war are a non-random sample, since they would tend to be older, slower, and less likely to incorporate new weapons, sensors, and other technologies that could affect survivability, unless backfitted during the war. The US had no DE’s in commission at the start of the war, further skewing the sample.
The numbers in the two reports point out some of the challenges with getting accurate data: since the US had no DE’s in commission at the start of the war, all 16 DE losses should come from those commissioned 1941-1945. But only 9 are annotated as “sunk” in the shipbuilding report. Similarly, 32 of the 349 DD’s commissioned during the war are listed as “sunk,” which when added to Hill’s figure of 29 destroyers in commission at the start of the war that were sunk comes nowhere close to the figure of 134 destroyers lost (nor even to Wills’ figure of 71, although it is over Hill’s figure of 58). But it doesn’t matter.
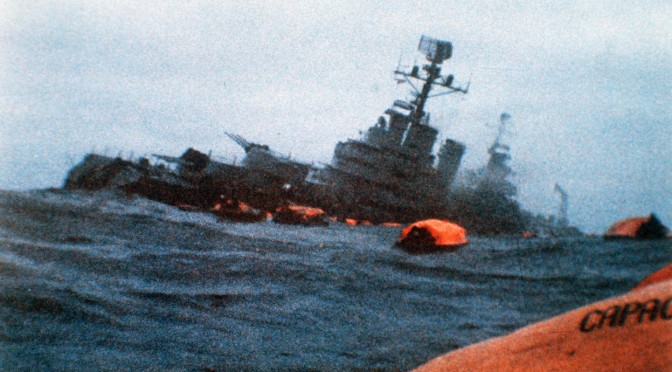
 The most significant figure in the WWII ship loss data is zero. That’s the number of ships lost to anti-ship cruise missiles. While it’s tempting to try to draw equivalencies between threats in WWII and threats today, the simple fact is that war at sea looks different today than it did then. The Falklands campaign, in which the Royal Navy lost two ships (a 5,000 ton destroyer and a 15,000 ton logistic ship) to Exocet missiles, and another five vessels (one LCU, two Type 21 frigates of 3,290 tons, a destroyer of 5,000 tons, and an auxiliary of 6,000 tons) to aerial bombs, may provide a more relevant frame of reference. British ship losses in the Falkland campaign totaled two of 15 frigates and two of 12 destroyers or larger. While these numbers are helpful, it’s worth remembering the facts behind the data: the RN were limited in their mobility by the need to protect the landing force; the Argentinians were operating at the outer limits of their range, limiting the duration of engagements. And with such a small sample, it’s risky to draw too-strong conclusions.
The most significant contributor to ship survivability is not getting hit. Hill argues that LCS will not be a priority target due to its small size and relative unimportance. Such an argument depends on the presence of perceived higher-value targets to draw fire. But the whole nature of the A2/AD problem is that it creates too much risk to put high-value targets under the threat umbrella. If LCS is the only surface platform we’ve got in the fight, it will be the platform that the adversary targets. (Worse, if LCS is heavily dependent on the proximity of vulnerable combat logistics force ships to stay in the fight, an adversary may not need to target LCS at all, choosing instead to sink the oilers, rendering LCS immobile and irrelevant.)
The debate about LCS survivability is important, especially as we look to up-arm the ships and give them more offensive punch. And, given the program’s history of overly-optimistic estimates of cost and capability, I understand why analysts would prefer to “go to the data,” rather than relying on assurances of improved survivability and defensive capability. But unfortunately, we don’t have access to survivability data in an unclassified debate. In the absence of the models and simulations that have been run on LCS versus modern threats, looking for examples from the past of different ship types versus different threats only clouds the picture. In short, going back to World War II data to try to prove a point about the survivability of large ships versus small ships in modern combat is about as relevant as pointing out that USS Constitution, a ship of only 1,500 tons, was so survivable that she earned the name, “Old Ironsides.”
Doyle Hodges is a retired Surface Warfare Officer currently pursuing PhD studies at Princeton’s Woodrow Wilson School of Public and International Affairs.


